Investors: When Free Float Cuts a $20B Market Cap to $12B
By MarketCapLens · Published · 8 min read

Free float market cap values a company using only the shares actually available for public trading, excluding what insiders, governments, and controlling shareholders hold back. It’s the number index providers use to set weightings and the number that tells you how much of a company’s stock is realistically investable. If a large chunk of shares is locked up, the investable market value can be far smaller than the headline market cap suggests.
TL;DR:
- A company’s free float excludes shares held by insiders, governments, and controlling shareholders, often reducing investable market value compared to total market cap.
- Fluctuations in free float—due to lockups, buybacks, or insider sales—can significantly alter index weights and market liquidity within weeks.
- Market providers use standardized exclusion rules and rounding to determine free-float factors, which directly impact index-eligible market capitalization.
- Small-cap firms with concentrated ownership can see free-float values drop sharply below total market cap, affecting liquidity and index inclusion.
- Large-cap companies with minimal insider or government holdings usually have a free float close to full outstanding shares, stabilizing their index weights.
Table of Contents
- What does free float mean in stock market terms?
- How do you calculate free-float market capitalization?
- Free-float market cap vs. total market cap: what’s the real difference?
- Why does free float matter for liquidity, volatility, and returns?
- How do index providers apply free-float methodology?
- What do real free-float numbers look like in practice?
- How MarketCapLens tracks free-float data for investors
- When should free float actually change how you invest?
- Sources
What does free float mean in stock market terms?
Free float, also called public float, is the slice of a company’s shares that trade freely among ordinary investors. It excludes anything held by parties unlikely to sell on the open market anytime soon.
To make sense of that, you need three terms straight:
- Outstanding shares: every share a company has issued, full stop, whether it trades freely or not.
- Restricted or locked shares: stock under a lockup agreement, often tied to a recent IPO or acquisition, that can’t be sold for a set period.
- Promoter or strategic holdings: shares held by founders, executives, governments, or controlling investors who typically hold for control rather than trade for profit.
Public float specifically excludes shares held by promoters, company officers, controlling-interest investors, or governments. You’ll find the raw numbers in a company’s 10-K or 20-F shareholder tables, in exchange disclosures, or in shareholder registers filed with regulators. None of this is hidden information. It’s just scattered across filings most casual investors never open.
How do you calculate free-float market capitalization?
The formula is simple once you have clean inputs:
Free-float market cap = share price × (outstanding shares − non-free shares)
Or, phrased the way Capital frames it: free float equals outstanding shares minus locked-in shares, and free-float market cap is share price multiplied by that free-float count.
Getting there requires a short checklist:
- Pull total outstanding shares from the company’s most recent quarterly or annual filing.
- Identify restricted shares under active lockup agreements, usually disclosed in IPO prospectuses or M&A filings.
- Identify strategic and insider holdings, including founder stakes, government ownership, and cross-holdings by other corporations.
- Subtract restricted and strategic shares from outstanding shares to get the free-float share count.
- Multiply that figure by the current share price.
Quick math: Say a company has 500 million shares outstanding, trading at $40. Insiders and a state investment fund hold 200 million shares combined. Free float is 300 million shares. Free-float market cap comes to $12 billion, versus a full market cap of $20 billion. The free-float methodology treats that $12 billion, not the $20 billion, as the portion Wall Street can actually buy and sell.
Many exchanges don’t use the exact float count.
Free-float market cap vs. total market cap: what’s the real difference?
Total market cap is share price times all outstanding shares, full stop. Free-float market cap only counts the shares that are actually tradable. The gap between the two numbers tells you something total market cap alone never will: how much of the company the public can realistically own.
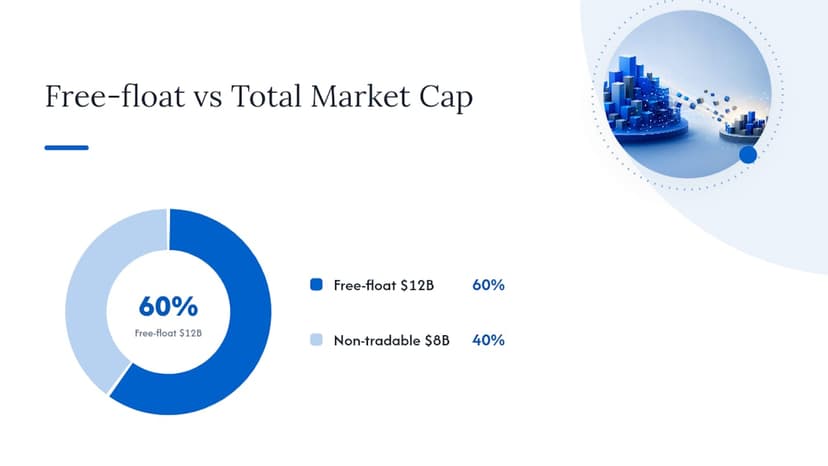
Use total market cap when you’re sizing up a company overall, comparing revenue multiples, or ranking by sheer scale. Use free-float market cap when you care about liquidity, index eligibility, or how easily you could build or exit a position without moving the price yourself.
The gap widens dramatically in specific situations:
- State-controlled enterprises, where a government retains a majority stake and only a minority trades publicly.
- Founder-led companies, where dual-class share structures let founders retain voting control while public float stays modest.
- Cross-held conglomerates, common in some Asian and European markets, where affiliated companies hold each other’s stock and neither block ever really trades.
A company with a $100 billion total market cap and a relatively modest free float has an investable value considerably less than its headline market cap. That’s the number that determines its weight in a free-float weighted index, not the headline figure.
Why does free float matter for liquidity, volatility, and returns?
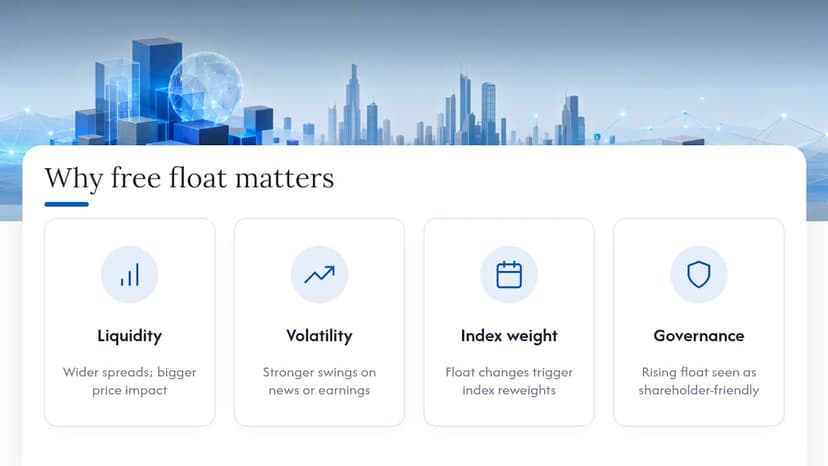
Float size drives three things investors feel directly: how easily you can trade, how much the price swings, and how the stock behaves inside index funds.
Liquidity tracks float closely. A stock with a small tradable base tends to have wider bid-ask spreads, and larger orders move the price more than they would in a heavily floated stock, according to explanatory research from Capital.com. That’s a real cost for anyone trying to build a meaningful position without tipping their hand.
Volatility follows the same logic. Fewer shares in circulation means fewer sellers absorbing sudden demand, so price swings tend to run hotter on low-float names, particularly around earnings surprises or news events.
Index weighting is where float changes become mechanically important. Free-float weighted indexes, the standard used by major benchmarks, adjust a company’s weight whenever its float changes materially. MSCI’s research found that increases in float have tended to be rewarded by the market, while decreases have been penalized, an effect that shows up more sharply in smaller, less liquid names. That’s not a coincidence. Fund flows tied to index rebalancing create real buying or selling pressure when a stock’s official float changes.
Data point: MSCI’s analysis also links float changes to corporate governance signals; a rising float often accompanies actions the market reads as shareholder-friendly, while a shrinking float can raise governance concerns among institutional holders.
Pro Tip: Check a stock’s free-float history before assuming a low float is permanent. Secondary offerings, insider unlocks, and buybacks can shift the number meaningfully within a single quarter, and that shift can trigger index rebalancing you won’t see coming otherwise.
How do index providers apply free-float methodology?
Index providers don’t just eyeball a company’s ownership structure. They run standardized exclusion rules, then apply a multiplier called the free-float factor to the total market cap.
Common exclusion categories look similar across providers:
- Insider and executive holdings: shares held by founders, directors, and officers, typically excluded regardless of size.
- Government stakes: state ownership in partially privatized companies, common in utilities and energy.
- Cross-holdings: shares one listed company holds in another, frequent in conglomerate-heavy markets.
- Locked-up shares: post-IPO or post-merger restricted stock still under contractual sale limits.
Once those exclusions are tallied, the provider calculates a free-float factor, essentially the free-float percentage rounded into a standardized band, and multiplies it by total market cap to get the index-eligible value. BSE India’s methodology publishes a clear example of this banding approach, rounding actual float percentages up to the nearest defined tier rather than using the raw decimal. S&P and FTSE apply comparable rounding conventions. The point of all this rounding isn’t precision for its own sake. It’s stability, so an index doesn’t get reweighted every time a handful of shares change hands. Investopedia’s overview confirms that free-float adjusted capitalization is now the standard approach across S&P, FTSE, and MSCI precisely because it reflects investable value better than raw share counts.
What do real free-float numbers look like in practice?
Numbers make this concrete faster than definitions do.
- Small-cap, concentrated ownership: A company shows a $2 billion total market cap, but the founding family holds 55% and a private equity firm holds another 20%. Free float is just 25%, putting investable market cap around $500 million, small enough that it may fall below the liquidity thresholds many index funds require.
- Large-cap, near-full float: A mega-cap technology company with a $900 billion total market cap and minimal insider ownership might carry a free-float factor near 0.98, keeping its index-eligible value almost identical to its headline number. Meta Platforms is a useful real-world reference point for how a widely held large-cap reports its share structure.
- Mid-cap with a recent lockup expiration: A company that IPO’d 18 months ago sees its float jump 15 percentage points overnight as an early lockup expires, a classic trigger for index rebalancing and a short-term supply shock in the stock.
A working checklist: check the latest 10-K or 20-F for share counts, scan recent 8-K filings for secondary offerings or block trades, note any upcoming lockup expiration dates, and flag sudden filings from large holders reporting share sales. Any of those four can move a free-float number meaningfully within weeks.
How MarketCapLens tracks free-float data for investors
Marketcaplens tracks real-time prices, sector breakdowns, and market-cap rankings across more than 2,500 public companies, updated multiple times daily. That scale matters when you’re trying to spot float changes before they show up in an index rebalance.
A practical workflow looks like this: pull up a specific company page to see current share price and outstanding share data, cross-reference historical trends to spot sudden jumps that might signal a lockup expiration or block sale, then compare the company against its sector ranking to see whether its float and liquidity profile look typical or unusual for its peer group.
For investors screening across an entire sector, comparing float-adjusted values side by side surfaces outliers that raw total market cap tends to hide.
When should free float actually change how you invest?
Low float isn’t automatically a red flag. It’s a risk that fits certain strategies and not others. Day traders should treat thin float as a real cost, wider spreads eat into short-term gains fast. Long-term holders can often look past it if the underlying business is sound. Index funds don’t get a choice; float dictates their weighting mechanically.
Watch for buybacks, block sales, and privatization moves. Each one reshapes the float, sometimes overnight, and sometimes enough to trigger a rebalance nobody saw coming.
— MarketCapLens
This article is general information, not a substitute for advice from a qualified financial advisor. Consult a qualified financial professional about your own circumstances before acting on anything here.
Sources
- Understanding Free-Float Methodology: Calculate Market Capitalization | Investopedia
- How Does Free Float Impact Stock Returns? | MSCI
- Public float - Wikipedia
- Capital
Recommended
For informational purposes only and is not investment advice. Do not rely on the facts, figures, ticker symbols, or other statements in this article — they may be incomplete, outdated, or incorrect, and we are not responsible for errors. See our disclaimer.