Prepare Audit Ready Historical Market Cap Data in 4 Steps for Analysts
By MarketCapLens · Published · 7 min read

Start with your sample size: single-ticker checks belong on free finance portals, repeated or bulk research belongs on an API or commercial dataset, and anything requiring provenance, exports, or sector context is faster on an integrated platform like MarketCapLens. Every source trades off coverage, sampling frequency, and cost differently, so match the tool to the task before you match the ticker to the chart.
TL;DR:
- Free portals are suitable for quick, one-time checks but often limit data history and export options, requiring upgrades for detailed analysis.
- APIs enable programmatic access for large datasets but require attention to sampling cadence, earliest available date, and proper unit conversion to ensure accuracy.
- Adjusting raw market cap figures for stock splits, buybacks, currency differences, and dual listings is essential for reliable historical analysis.
- Cross-checks between multiple data sources help identify discrepancies in market cap totals, especially when working with different provider methodologies.
- MarketCapLens offers continuous updates, sector comparisons, and ranking insights, ideal for ongoing research without building complex pipelines.
Marketcaplensmarketcaplens.comExplore Historical Market Cap TrendsMarketCapLens combines historical data, sector breakdowns, and market rankings to support more informed analysis across thousands of public companies.Explore MarketCapLens
Table of Contents
- Where Can You Find Historical Market Cap Data?
- How Do APIs Deliver Historical Market Cap Data?
- Why Do Historical Market Cap Figures Need Adjustment?
- How Do You Use Historical Market Cap Data in Analysis?
- What Does MarketCapLens Offer for Historical Market-Cap Research?
- Free Lookups, APIs, or a Platform: Which Fits Your Research?
- Start Exploring Historical Market Cap Trends on MarketCapLens
- Sources
Where Can You Find Historical Market Cap Data?
Four source categories cover almost every research need, and they rarely overlap in strength.
Free finance portals are the fastest option for a single lookup. Type in a ticker, pull up a chart, and you have a rough sense of how a company’s valuation moved over the past year. The catch: most portals cap how far back you can pull data, and exporting clean CSV files often requires a workaround or a premium tier you didn’t plan on paying for.
Public aggregators and chart trackers work at the opposite end of the spectrum. They’re built for macro questions, not stock-picking. The SIFMA Capital Markets Fact Book compiles exactly this kind of aggregated statistic, reporting that global equity market capitalization rose significantly year over year to over $150 trillion in 2025. That figure is invaluable for sanity-checking a provider’s totals, but aggregator methodology varies enough between sources that regional and country splits rarely match exactly from one tracker to the next.
Commercial datasets sit in the middle. You pay for longer backfills, reconciled figures, and support when something looks wrong. Licensing terms vary widely, so read the fine print before you build a research pipeline around one.
APIs give you programmatic access, which matters once your research moves past a handful of tickers.
A rough decision guide:
- Need one number for one company, right now? Use a free portal.
- Need years of history across dozens of tickers? Use an API.
- Need audited, reconciled figures for a paper or filing? Use a commercial dataset.
- Need rankings, sector context, and export-ready series in one place? Use an integrated platform.
Before committing to any source, check its earliest available date and confirm which exchanges it actually covers. A provider that claims “global coverage” but only backfills US-listed equities to 2019 will quietly break a longer-horizon study.
How Do APIs Deliver Historical Market Cap Data?
Programmatic access solves the volume problem, but only if you understand the shape of what comes back.
EODHD’s Historical Market Capitalization API returns weekly series for US-listed equities on the NYSE and NASDAQ, formatted as date/value pairs in raw USD. A typical response is a JSON object keyed by index, with each entry carrying a date field and a value field. Some providers offer CSV as an alternative, structured the same way: date, value, one row per observation.
Before integrating any API into a workflow, confirm four things:
- Sampling cadence. Many market-cap series update weekly rather than daily.
- Earliest available date. EODHD’s coverage for this endpoint generally starts around 2019.
- Access tier. Demo tokens usually cover a short list of sample tickers like AAPL.US; production use requires a real API key and a rate-limit plan for bulk pulls.
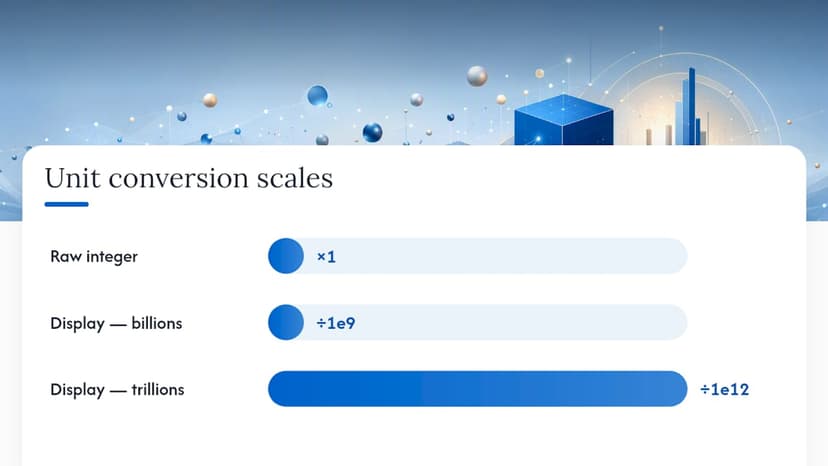
- Unit conversion. Values typically arrive as raw integers, so you’ll divide by 1e9 or 1e12 to display billions or trillions correctly.
| Consideration | What to check |
|---|---|
| Sampling frequency | Daily vs. weekly (Thursday/Friday) |
| Coverage | Exchanges included, earliest date |
| Format | JSON keyed object vs. CSV date/value |
| Access | Demo token limits vs. production API key |
| Rate limits | Calls per minute/day for bulk requests |
Pro Tip: Batch your API calls by ticker rather than by date range. Most rate limits are structured per request, so pulling one ticker’s full history in a single call burns far fewer calls than looping through months for every symbol.
Why Do Historical Market Cap Figures Need Adjustment?
Raw market-cap numbers hide a surprising amount of noise, and most of it traces back to share-count changes.
Stock splits, buybacks, and secondary offerings all change outstanding share count without necessarily moving the share price in the same direction. Providers typically apply split adjustments automatically, but you should still verify them against a second source, especially around known corporate-action dates. Technical documentation from EODHD notes that computing accurate, split-adjusted daily share counts across thousands of tickers is intensive enough that many datasets default to weekly sampling instead, which is precisely why daily precision claims deserve a second look.
Currency normalization is the next trap. Most providers report values in raw USD regardless of a company’s primary listing currency, so cross-market comparisons need an explicit conversion step if you’re working from a non-USD source.
Dual listings cause a third kind of headache. A company listed on two exchanges, or trading under dual-class share structures, may get combined differently depending on the provider’s own methodology notes. Some consolidate share classes into one figure; others report them separately.
Before trusting any series, run a reconciliation pass:
- Cross-check totals against a second provider for at least three known dates.
- Log the provider name, retrieval date, and query parameters for every pull.
- Flag any date where two sources diverge by more than a few percentage points and investigate before proceeding.
How Do You Use Historical Market Cap Data in Analysis?
A clean workflow keeps you from building a model on top of a silent data error.
- Download the raw series from your chosen source, keeping the original format (JSON or CSV) intact for the audit trail.
- Clean it by applying corporate-action adjustments and confirming split treatment matches your source’s documentation.
- Normalize frequency and currency so every series in your dataset shares the same sampling cadence and denomination.
- Visualize or backtest using consistent date keys across tickers, converting to log returns when you’re studying trend behavior rather than absolute levels.
For multi-company work, building a market-cap-weighted index smooths out single-stock noise and makes sector rotation easier to spot. Whatever the frequency, keep it locked before merging series. Mixing a weekly EODHD pull with a daily portal export is the single fastest way to introduce phantom volatility into a chart that isn’t actually there.
What Does MarketCapLens Offer for Historical Market-Cap Research?
The platform tracks thousands of public companies, with figures updated frequently and organized by sector for direct comparison. Instead of stitching together raw pulls from separate providers, you get rankings, sector allocations, and time-series views built for the kind of desk research this guide has been describing.
What that looks like in practice:
- Time-series views for tracking how a company’s valuation shifted across a chosen window.
- Sector breakdowns for spotting rotation between industries as market caps rise and fall.
- Ranking tables refreshed multiple times daily, useful for identifying when a company moves in or out of a size tier.
Fit depends on the scope. If your research needs deep tick-by-tick history or a formal audit trail with licensed redistribution rights, a commercial dataset with a documented methodology for handling dual-class shares is worth the added cost. For tracking sector-level trends or checking where a company ranks today against its peers, MarketCapLens covers that ground without a separate export pipeline.
Free Lookups, APIs, or a Platform: Which Fits Your Research?
Match the tool to the sample size, not the other way around. A single spreadsheet check on one ticker rarely justifies an API key. A study spanning hundreds of companies over a decade rarely survives on manual portal lookups, and that’s where an API or a reconciled commercial dataset earns its cost. When the work calls for rankings, sector context, and exports in one pass rather than three separate tools, an integrated platform saves the hours you’d otherwise spend stitching sources together by hand.
— MarketCapLens
Start Exploring Historical Market Cap Trends on MarketCapLens
If you’ve read this far, you already know the tradeoffs: free portals for a quick check, APIs for volume, commercial datasets for audit trails, and a platform when you need rankings and sector context without building your own pipeline. This platform fits that last category directly, tracking thousands of companies with rankings and sector breakdowns updated multiple times daily, so you’re not reconciling three separate exports before you can even start charting a trend.

If you’re still confirming the basics before you dig into a full time series, the plain-English guide to market capitalization is a fast way to make sure your terminology lines up with what the data actually measures. When you’re ready to look at real numbers, head to the MarketCapLens rankings page and pull up a company or sector to see how the current figures compare against where they stood a year ago.
This article is general information, not a substitute for advice from a qualified financial advisor. Consult a qualified financial professional about your own circumstances before acting on anything here.
Sources
Recommended
For informational purposes only and is not investment advice. Do not rely on the facts, figures, ticker symbols, or other statements in this article — they may be incomplete, outdated, or incorrect, and we are not responsible for errors. See our disclaimer.