Mega Cap Stocks: $200B Threshold and a 2026 Investor Snapshot
By MarketCapLens · Published · 11 min read

Mega-cap stocks are publicly traded companies whose market capitalization puts them at the very top of the market, commonly $200 billion or more. That threshold isn’t a legal line, and different index providers slide it around, but it’s the number FINRA and Investopedia both point to. A current top-10 snapshot follows below.
TL;DR:
- Most mega-cap stocks are currently valued above $1 trillion, with seven of the top ten in technology, AI, and semiconductor sectors.
- Classification of mega caps varies by index provider, and a stock’s market cap can fluctuate rapidly, making snapshots only temporarily relevant.
- Mega caps tend to be less volatile and offer steady dividends, but they face concentration, valuation, and sector risks that can impact returns.
- Interest rate hikes disproportionately affect mega caps, especially growth-oriented technology stocks that rely on future earnings valuation.
- Portfolio diversification requires more than mega cap exposure alone, as their concentration and sector biases can increase regulatory and geopolitical risks.
Table of Contents
- How Market Cap Is Calculated (And Why Definitions Shift)
- The Trillion-Dollar Club: Today’s Biggest Mega-Cap Stocks
- Which Indices and Funds Actually Track Mega-Cap Stocks?
- Why Mega-Cap Stocks Matter, and Where They Can Hurt You
- How to Track Mega-Cap Stocks and Act on What You See
- How Mega-Cap Stocks Have Performed Compared to Smaller Companies
- How Interest Rates and Inflation Move Mega-Cap Stocks
- Dividend Habits Among the Largest Public Companies
- Where Mega-Cap Stocks Fit in a Diversified Portfolio
- Regulatory and Geopolitical Risks That Target the Biggest Companies
- A Note From Marketcaplens on How We Track This Data
- Track Mega-Cap Stocks Without Waiting on Quarterly Reports
- Sources
How Market Cap Is Calculated (And Why Definitions Shift)
Market capitalization is shares outstanding multiplied by share price. Nothing more exotic than that. A company with 15 billion shares trading at $20 has a $300 billion market cap, full stop, and that single number is what sorts it into large cap, mega cap, or somewhere else entirely.
The industry convention, echoed by FINRA’s investor education page, sets rough bands like this:
- Mega cap: roughly $200 billion or more
- Large cap: about $10 billion to $200 billion
- Mid cap: about $2 billion to $10 billion
- Small cap threshold: typically below $2 billion
Those bands aren’t fixed by regulation, which is why classification gets messy. Index providers set their own mega cap definition based on fund strategy and constituent count, not a universal rulebook. Wikipedia’s entry on megacap stocks notes there’s no single official definition at all, just overlapping conventions.
That also means classification is temporary. A stock priced at $195 billion today can cross into mega cap territory on a strong earnings pop and slide back out on a bad quarter. Nothing about the label is permanent, which is exactly why point-in-time snapshots matter more than a static list you bookmark and forget.
The Trillion-Dollar Club: Today’s Biggest Mega-Cap Stocks
The clearest way to see mega cap stocks in action is to look at who currently sits above $1 trillion. A June 2026 roundup from WTOP counted roughly 16 companies in that club, led by a cluster of familiar names whose businesses could not be more different from one another.
| Company | Sector | Why it matters |
|---|---|---|
| Nvidia | Semiconductors | Dominant supplier of AI training and inference chips |
| Apple | Consumer technology | Massive installed base and services revenue |
| Alphabet | Internet/search | Search, cloud, and AI model development |
| Microsoft | Software/cloud | Enterprise software plus Azure cloud infrastructure |
| Amazon | E-commerce/cloud | Retail scale paired with AWS cloud dominance |
| Meta Platforms | Digital advertising | Social platforms feeding an AI-driven ad engine |
| Tesla | Automotive/energy | EV manufacturing plus energy storage ambitions |
| Berkshire Hathaway | Diversified holding | Insurance float funding a sprawling equity portfolio |
| Eli Lilly | Pharmaceuticals | Weight-loss and diabetes drug demand |
| Taiwan Semiconductor (TSMC) | Semiconductor manufacturing | Manufactures chips for Nvidia, Apple, and most major fabless firms |
These figures are point-in-time and move daily. For a live view, MarketCapLens’s rankings page updates company-by-company data multiple times a day rather than on a quarterly lag.
What jumps out from that list isn’t just the size, it’s the concentration. Seven of these ten names trace their valuation back to some combination of AI infrastructure, cloud computing, or chip manufacturing. That’s a narrower growth story than the index as a whole suggests, and it’s worth remembering before assuming “mega cap” automatically means “diversified.”
Which Indices and Funds Actually Track Mega-Cap Stocks?
Ask five index providers to define mega cap and you’ll get five different answers, because each one solves a different problem. Some fix the number of holdings, others set a market-cap floor and let the count float.
- Russell Top 200 / Top 50: captures a fixed number of the largest US companies rather than a dollar threshold.
- MSCI USA Mega Cap Select: typically limits itself to 30 to 50 names and may require new entrants to clear roughly $220 billion, according to Morningstar’s index documentation.
- CRSP: targets the top 70% of investable US market cap rather than naming a fixed count or dollar cutoff.
- Morningstar US Mega Cap: built from the same market-cap-floor logic as MSCI, though its constituent count moves with the market.
Investors get exposure through cap-weighted ETFs and index mutual funds tracking any of these benchmarks. The methodology matters for one practical reason: a fund tracking Russell’s fixed-count approach can hold a smaller company than a fund using a market-cap floor, which changes performance attribution and turnover in ways that aren’t obvious from the fund’s name alone.
Why Mega-Cap Stocks Matter, and Where They Can Hurt You
Mega cap stocks earn their reputation for a few concrete reasons. They tend to be highly liquid, so large orders don’t move the price much. Many pay steady dividends. And a business generating tens of billions in annual revenue usually has fewer wild swings tied to any single product cycle than a smaller competitor would.
None of that makes mega caps risk-free.
- Concentration risk. When a handful of companies drive most of an index’s return, a downturn in one sector (say, AI infrastructure spending) can drag the whole benchmark down with it.
- Valuation sensitivity. These stocks often trade at premium multiples, and premium multiples compress hard when growth disappoints even slightly.
- Slower relative growth. A $2 trillion company can’t double its revenue as easily as a $20 billion one can, a mathematical reality that shows up in long-run return comparisons noted by The Motley Fool’s coverage of the largest companies by market cap.
Pro Tip: Check what percentage of your total equity allocation sits in the top five S&P 500 names before assuming your portfolio is diversified. Cap-weighted index funds can quietly concentrate you in the same five or six mega caps no matter which fund ticker you bought.
Position sizing matters more with mega caps than most investors assume. If concentration bothers you, an equal-weight fund or a deliberate sector tilt can rebalance that exposure without abandoning mega cap holdings entirely.
How to Track Mega-Cap Stocks and Act on What You See
Watching mega cap stocks well means tracking more than just the market-cap number itself.
- Build a watchlist that includes market cap, revenue growth, forward P/E, and sector weighting side by side, not in isolation.
- Set an allocation rule of thumb before you invest, not after: decide upfront what percentage of your equity sleeve goes to cap-weighted mega cap exposure versus equal-weight or mid cap tilts.
- Flag valuation stretch as a trim signal. A stock crossing 40 times forward earnings on hype alone deserves a second look, regardless of its size.
- Watch for index reconstitution events. When Russell or MSCI rebalances quarterly or annually, mega cap constituents can shift in or out, moving fund flows with them.
- Recheck your sector exposure after any rebalance, since mega cap indices skew toward technology far more than the broader market does.
MarketCapLens’s rankings dashboard refreshes throughout the day, which makes it easier to catch a reclassification before it shows up in next month’s fund report.
How Mega-Cap Stocks Have Performed Compared to Smaller Companies
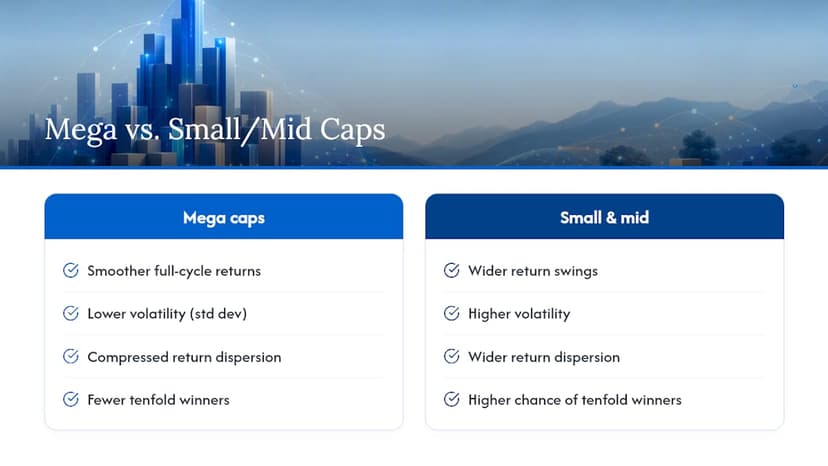
Mega cap stocks have generally delivered smoother rides than small or mid cap stocks over full market cycles, largely because scale buys some insulation from single-product failures or regional demand shocks. A company generating revenue across dozens of countries and product lines doesn’t crater the way a single-product small cap can when one line disappoints.
That smoothness has limits. During sharp risk-off periods, mega caps can still fall hard, sometimes harder than expected, because they’re the most liquid names to sell first when institutional investors need cash quickly. The 2022 rate-driven selloff hit several trillion-dollar technology names by 30% or more from peak, even as their underlying businesses kept growing revenue.
Small and mid cap stocks tend to show wider return dispersion, meaning more winners that beat the market by a wide margin and more losers that badly lag it. Mega caps compress that spread. You’re less likely to own the next tenfold winner in the mega cap bucket, but you’re also less likely to hold a stock that goes to zero. That trade-off, smoother average returns in exchange for a lower ceiling, is the core reason mega caps anchor so many core portfolio allocations rather than serving as the growth engine.
Volatility measured by standard deviation typically runs lower for mega caps than for small caps across most rolling periods, though sector concentration in recent years (particularly the AI-driven run-up in chip and cloud names) has pushed correlation among the largest stocks higher than historical norms would suggest.
How Interest Rates and Inflation Move Mega-Cap Stocks
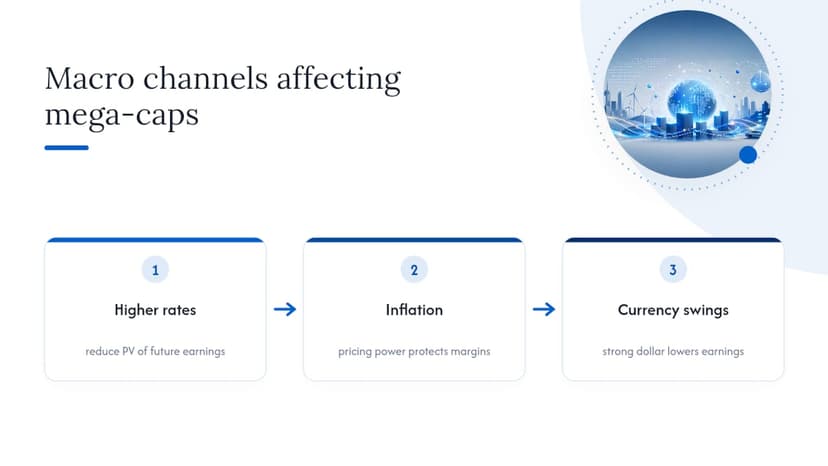
Mega cap valuations respond to interest rate changes more than many investors expect, especially among the technology-heavy names that dominate today’s largest-company list. Higher rates reduce the present value of future earnings, and mega cap growth stocks price in years of future earnings, so they take an outsized hit when the discount rate rises.
That’s exactly what played out when central banks raised rates aggressively starting in 2022. Growth-oriented mega caps sold off harder than value-oriented ones, even though their fundamentals hadn’t necessarily deteriorated. The selloff was a rate story, not a business story.
Inflation cuts differently depending on the company. Mega caps with strong pricing power, think consumer staples and dominant platform businesses, can pass rising costs to customers without losing much volume. Mega caps competing on thin margins or heavy input costs have less room to maneuver. That’s part of why sector matters as much as size when assessing how a mega cap stock will weather an inflationary stretch.
Currency swings matter too. A large share of mega cap revenue comes from overseas, so a strengthening dollar can quietly shave reported earnings even when local-currency sales are growing. That’s a detail easy to miss if you’re only watching the market-cap number and not the revenue mix behind it.
Dividend Habits Among the Largest Public Companies
Dividend policy among mega cap stocks splits into two camps. Established mega caps with mature, cash-generative businesses, think Microsoft, Berkshire Hathaway’s underlying holdings, and most large pharmaceutical names, tend to pay steady, growing dividends and often carry decades-long records of raising them annually. Eli Lilly, for instance, has maintained dividend payments through its recent growth surge even as its stock price has climbed sharply.
Newer mega caps built around rapid growth often skip dividends entirely, preferring to reinvest cash into capital expenditure. Alphabet paid no dividend for most of its public history and only recently began returning cash to shareholders. Tesla still pays none. Nvidia’s dividend yield is negligible relative to its market cap because reinvestment in chip fabrication capacity has been the priority.
That split means mega cap yield, taken as a group average, tells you less than looking at individual payout policy. A mega cap index fund’s blended yield can look modest not because these companies are stingy but because a few of the largest names contribute zero income while others contribute steadily. Investors building an income sleeve around mega caps need to look at the constituents, not just the category label.
Where Mega-Cap Stocks Fit in a Diversified Portfolio
Mega cap stocks tend to function as the ballast of a diversified equity allocation rather than its growth engine. Their liquidity, established cash flows, and market leadership make them a reasonable core holding, the kind of position you can size confidently without worrying about a liquidity crunch on the way out.
The mistake is treating mega cap exposure as diversification by itself. Most cap-weighted US index funds are already mega cap heavy by construction, since price weighting naturally tilts toward the largest names. Adding a dedicated mega cap fund on top of an S&P 500 index fund often just doubles down on the same handful of companies rather than spreading risk. Real diversification means pairing mega cap exposure with mid cap, small cap, and international allocations that don’t move in lockstep with the same five or six dominant names.
Regulatory and Geopolitical Risks That Target the Biggest Companies
Size itself invites regulatory attention that smaller companies rarely face. Antitrust scrutiny has followed several major technology mega caps for years, with government actions targeting search dominance, app store practices, and advertising market power. A single adverse ruling can shift billions in market cap overnight, something that’s happened repeatedly across recent antitrust proceedings against the largest tech names.
Geopolitical exposure adds another layer, particularly for companies with concentrated manufacturing or revenue tied to specific regions. Taiwan Semiconductor’s central role in global chip supply makes it uniquely exposed to cross-strait tensions, a risk factor that shows up in analyst commentary far more than it does for a domestically focused mega cap. Companies with heavy China exposure face a similar dynamic: trade policy shifts, export controls, and tariff changes can move mega cap earnings estimates within a single news cycle. Reviewing a company’s risk exposure through fundamental position sizing before concentrating a portfolio in any single name, mega cap or not, is one of the more overlooked steps individual investors skip.
A Note From Marketcaplens on How We Track This Data
Rankings are updated across a large number of companies multiple times daily, which is how the snapshot above stays current rather than stale. The trillion-dollar list changes as prices move, and live data catches that faster than a quarterly report can. Readers can pull rankings sorted by sector or market cap to build their own watchlist.
— MarketCapLens
Track Mega-Cap Stocks Without Waiting on Quarterly Reports
Static lists go stale the moment a stock moves 5% overnight, and mega cap rankings shift more often than most investors check them. Marketcaplens’s live rankings update throughout the day across more than 2,500 companies, so you’re checking current numbers instead of last month’s snapshot.

Every company page breaks down sector classification, historical performance, and where a stock sits relative to the mega cap, large cap, and mid cap thresholds discussed above. If you’re new to the mechanics behind these numbers, the plain-English guide to market capitalization walks through the calculation step by step. Pull up the rankings page now, sort by sector, and see exactly where today’s mega caps stand before you adjust a single position.
Sources
For the regulatory framing behind size categories, see Investor. For deeper explanatory context, Investopedia’s mega cap definition and Wikipedia’s entry on megacap stocks both cover index-methodology history in more depth than fits here.
- Finra
- Mega Cap: Companies With Market Caps Above $200 Billion | Investopedia
- The trillion-dollar club: mega-cap stocks with market caps over $1 trillion - WTOP News
- Megacap stock — Wikipedia
Recommended
For informational purposes only and is not investment advice. Do not rely on the facts, figures, ticker symbols, or other statements in this article — they may be incomplete, outdated, or incorrect, and we are not responsible for errors. See our disclaimer.