Blog
Beta vs Volatility: Formula, R squared, MarketCapLens for Investors
By MarketCapLens · Published · 14 min read

Volatility measures how much an asset’s price swings, period, regardless of why. Beta measures only how much of that swing tracks the broader market. Check volatility when you’re sizing a position or setting a stop; check beta when you’re managing how exposed your portfolio is to a market downturn.
TL;DR:
- Beta measures the systematic risk relative to a benchmark, while volatility reflects total price swings regardless of cause.
- A high beta (above 1) indicates amplified market moves, but it may still have low total volatility if movements are poorly correlated.
- Calculating beta depends on the chosen window, and short-term estimates can be misleading during market shifts or company changes.
- Market conditions like bull or bear phases affect both metrics, often causing betas to cluster around 1 during stress and understate risk during calm periods.
- Use beta to manage market exposure and volatility to set position sizes or stops, but always consider their limitations and the correlation between assets.
MarketcaplensCompare Market Trends With More ContextMarketCapLens brings together share prices, market capitalization, historical data, and sector breakdowns for thousands of public companies.Explore MarketCapLens
Table of Contents
- Beta vs. Volatility: The Core Difference
- How Do You Measure Volatility?
- What Is the Beta Coefficient and How Is It Calculated?
- How Do Beta and Correlation Connect to Volatility?
- When Should You Use Beta vs. Volatility?
- Beta 0.5 vs. High Volatility: A Numeric Walkthrough
- Where to Find Beta and Volatility Signals on MarketCapLens
- Do Time Horizons Change How You Read Beta and Volatility?
- How Do Bull and Bear Markets Change Beta and Volatility?
- How Do Stocks, Bonds, and ETFs Compare on Beta and Volatility?
- Should You Evaluate Beta and Volatility Differently for a Single Stock vs. a Portfolio?
- Our Take: Use Both, Trust Neither Blindly
- Sources
- FAQ
Beta vs. Volatility: The Core Difference
Volatility is total risk. It’s the standard deviation of an asset’s returns, and it doesn’t care whether the price moved because of a market crash, an earnings surprise, or a CEO’s resignation. Beta, by contrast, measures systematic risk, the slice of an asset’s movement that’s explained by the market’s own movement. An asset can swing wildly and still have a low beta, if those swings have nothing to do with what the S&P 500 is doing that day.
That distinction matters because the two metrics answer different questions entirely. Volatility answers “how big could the move be?” Beta answers “how much of that move is market-driven, and in which direction?” A biotech stock awaiting a drug trial result might have enormous volatility and a beta close to zero, because its price action is idiosyncratic, tied to a binary event rather than to macro sentiment. A cyclical industrial stock might have middling volatility but a beta above 1.5, because it moves in lockstep with, and more sharply than, the broader market.
Understanding market volatility starts with recognizing it’s a measure of dispersion, not direction. Beta interpretation, meanwhile, always requires a benchmark. There’s no such thing as beta in isolation. It’s always beta relative to something, usually a broad index.
How Do You Measure Volatility?
Volatility measurement typically means calculating the standard deviation of an asset’s periodic returns, then annualizing that figure so it’s comparable across time horizons. Daily standard deviation gets scaled by the square root of roughly 252 trading days to produce an annualized number.
There are two flavors worth separating:
- Historical (realized) volatility looks backward at actual price changes over a chosen window, say 30, 90, or 252 trading days.
- Implied volatility looks forward. It’s derived from option prices and reflects what the market currently expects future volatility to be.
FINRA draws a clean line between the two: historical volatility tells you what happened, implied volatility tells you what traders are pricing in right now. The CBOE Volatility Index (VIX) is the most cited implied-volatility benchmark, built from S&P 500 option prices, and it spikes hard during market stress.
Double that volatility and you roughly double the range of plausible outcomes, which is exactly why options on high-volatility names cost more.
Short-term traders lean on shorter windows and implied volatility; long-term investors care more about how realized volatility behaves across full market cycles.
What Is the Beta Coefficient and How Is It Calculated?
The beta coefficient is calculated as the covariance between an asset’s returns and the market’s returns, divided by the variance of the market’s returns: β = Cov(asset, market) / Var(market). In plain terms, it’s a regression slope. Run a line of best fit between a stock’s daily returns and the market’s daily returns, and the slope of that line is beta.
There’s a second, more intuitive way to express the same number: β = ρ·σ_i/σ_m, where ρ is the correlation between the asset and the market, σ_i is the asset’s own volatility, and σ_m is the market’s volatility. This identity, laid out on Wikipedia’s beta finance page), shows that beta isn’t just about how much an asset moves. It’s about how much it moves relative to the market, filtered through how closely correlated the two actually are.
That’s where R-squared earns its keep. R-squared tells you what percentage of an asset’s return variance is actually explained by the benchmark. A low R-squared means beta is statistically weak for that asset, and trusting it for hedging or CAPM work is a mistake. A high R-squared means the regression line fits well and beta is doing real work.
Reading the numbers:
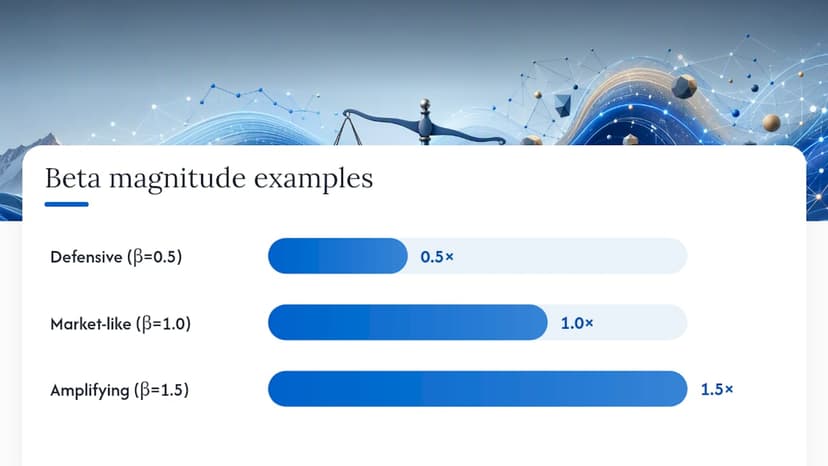
- Beta of 0.5: the stock has historically moved about half as much as the market in the direction the market moves. Northwestern Mutual calls this a defensive profile, often useful for capital preservation but may lag during strong rallies.
- Beta of 1.0: the asset tends to move in step with the market, no more, no less.
- Beta of 1.5: the asset amplifies market moves by 50%. A 10% market drop implies roughly a 15% drop, all else equal.
How Do Beta and Correlation Connect to Volatility?
The identity β = ρ_{i,m} · (σ_i / σ_m) is worth sitting with, because it’s the mathematical bridge between beta and correlation and volatility, all in one line. Unpack the three pieces and the relationship gets concrete:
- Correlation (ρ) measures the direction and strength of the relationship between the asset and the market, bounded between negative 1 and positive 1. If ρ is low, beta shrinks no matter how volatile the asset is.
- Asset volatility (σ_i) is the stock’s own standard deviation. A more volatile stock pushes beta higher, but only in proportion to how correlated it is.
- Market volatility (σ_m) is the denominator. When the market itself gets calmer or choppier, every asset’s beta shifts even if nothing about the asset changed.
This produces real edge cases. Meanwhile, a modestly volatile utility stock with high correlation to the market can post a respectable beta despite calm price action.
Sampling choices distort the picture too. Betas estimated from daily returns versus monthly returns can diverge meaningfully, and a beta calculated over a rolling 60 day window will drift compared to one calculated over five years. There’s no single “true” beta, only a beta specific to the window and frequency you chose.
When Should You Use Beta vs. Volatility?
Beta and volatility serve different jobs in portfolio construction, and mixing them up leads to bad hedges.
- Use beta when you’re sizing index exposure, hedging systematic risk with futures or index puts, or running CAPM-style expected return calculations.
- Use volatility when you’re setting stop losses, sizing individual positions, pricing options, or estimating how wide a stock’s likely range is over the next month.
- Combine both by using beta to gauge market exposure and volatility to gauge the amplitude of the moves within that exposure. Always glance at R-squared before leaning on beta for anything important.
Investopedia’s guidance on using beta for risk assessment makes a point worth repeating: a portfolio stuffed with high-beta names can still be badly undiversified if those names all belong to the same sector and move together during a shift, like the concentrated momentum you’d see across the Magnificent 7 stocks.
Pro Tip: Before you size a hedge off a beta number, check how old the regression window is. A beta calculated from 2021 to 2023 data may not reflect how a stock behaves in a 2026 rate environment.
Both metrics share the same weakness: they’re backward-looking, and volatility tends to cluster, meaning calm periods and turbulent ones both persist longer than intuition suggests.
Beta 0.5 vs. High Volatility: A Numeric Walkthrough
Numbers make the distinction stick better than definitions do.
- Scenario A: beta of 0.5, moderate volatility. If the market drops significantly in a month, this stock’s market-sensitive component implies a proportional decline. Its moderate annualized volatility suggests its typical monthly range, outside of that market move, stays fairly contained. This is the profile of a defensive consumer staples name: smaller downside in a selloff, but also a smaller bounce if the market rallies hard.
- Scenario B: beta of 1.5, higher volatility. The same market drop implies a proportionally larger decline from the beta component alone. But the higher volatility figure means idiosyncratic swings on top of that market move could be substantial, in either direction.
For capital preservation, Scenario A wins on paper. For upside capture in a bull run, Scenario B has more torque, at the cost of a rougher ride and a harder floor to defend during drawdowns.
Where to Find Beta and Volatility Signals on MarketCapLens
You don’t need a Bloomberg terminal to approximate these numbers. On MarketCapLens, individual company pages carry real-time prices and historic return data across thousands of listed companies, updated multiple times a day.
A practical workflow looks like this:
- Open a company page and pull historic daily or monthly returns over your chosen window.
- Calculate the standard deviation of those returns to approximate volatility.
- Compare those same returns against a benchmark index over the identical window to approximate correlation and, from there, beta.
- Cross-check sector breakdowns to see whether the stock’s behavior looks typical for its industry group or like an outlier.
The limitation is the same one that applies everywhere in this topic: your result is only as good as the window you picked, and it’s still backward-looking. Recompute periodically rather than treating one calculation as permanent.
Do Time Horizons Change How You Read Beta and Volatility?
Yes, and the effect is bigger than most investors assume. A stock’s beta calculated over a five-year window can look meaningfully different from its beta over the trailing 90 days, especially for a company that’s changed business lines, gone through a leadership shift, or shifted its debt load.
Short time horizons make both metrics noisier. A stock’s 30-day realized volatility can spike hard around a single earnings report and then settle back down within weeks, giving a distorted read if that’s the only window you check. Beta over short windows suffers the same problem: a handful of unusual trading days can swing the regression slope, especially for lower-liquidity names where a few large trades carry outsized weight.
Longer horizons smooth out noise but introduce a different problem: they blend together periods when the company’s actual risk profile was different. A stock that pivoted from a cyclical industrial business to a subscription software model five years ago will show a beta that reflects some mix of both identities if you calculate it over the full period.
The practical fix isn’t picking one “correct” horizon. It’s matching the horizon to the decision. A trader holding a position for two weeks should weight recent, short-window volatility heavily. An investor building a ten-year retirement allocation should look at beta and volatility across multiple market cycles, including at least one downturn, since a beta calculated only during a bull run tends to understate how an asset behaves when the market actually falls.
How Do Bull and Bear Markets Change Beta and Volatility?
Beta and volatility aren’t fixed properties of an asset. They shift with market conditions, and the shift itself carries information.
During bull markets, overall market volatility tends to compress, and that compression mechanically inflates beta for assets with even modest correlation to the market, since the denominator in the beta formula (market variance) shrinks. Betas measured during calm bull runs can understate how sharply an asset will move once volatility returns.
Bear markets and periods of stress tend to raise correlations across almost everything. Stocks that behaved independently during calm periods start moving together as investors sell broadly and indiscriminately, a phenomenon sometimes called correlation convergence. That pushes many betas closer to 1 during a downturn, even for names that looked defensively low-beta beforehand. Volatility, meanwhile, spikes across nearly every asset during bear markets. The VIX’s historical pattern, tracked as an implied-volatility benchmark by FINRA, shows this clearly: it sits low during calm bull markets and jumps sharply during selloffs.
The practical takeaway is that a beta or volatility figure calculated entirely within one type of market regime deserves skepticism. If your data window only covers a multi-year bull run, you’re not seeing how the asset behaves under stress, which is precisely when knowing its real risk profile matters most.
How Do Stocks, Bonds, and ETFs Compare on Beta and Volatility?
Beta was built with equities in mind, using a stock index as the benchmark, and it translates less cleanly to other asset classes.
Individual stocks show the widest range of both metrics.
Bonds behave differently enough that equity beta often stops being useful. Investment-grade bond volatility is typically much lower than equity volatility, and bond returns correlate weakly, sometimes negatively, with stock market returns, which is exactly why bonds get used as portfolio ballast. Calculating a stock-market beta for a bond fund tends to produce a number close to zero or even negative, which is accurate but not always the most informative lens; duration and credit spread matter more for bond risk than equity beta ever will.
ETFs sit in between and vary enormously by construction. A broad market index ETF will show a beta near 1.0 by design, since it’s built to track that index. A sector ETF, like one concentrated in basic materials or high-growth technology, can post a beta well above 1 along with volatility that swings hard with commodity prices or interest rate expectations. Leveraged ETFs push both metrics further, mechanically amplifying daily market moves by design, which also amplifies their volatility figures in ways that compound unfavorably over longer holding periods.
Should You Evaluate Beta and Volatility Differently for a Single Stock vs. a Portfolio?
A single stock’s beta and volatility describe that stock in isolation. A portfolio’s beta and volatility describe something else: the combined behavior of everything you hold, and that combination rarely behaves like the simple sum of its parts.
Portfolio beta is a weighted average of individual holding betas, weighted by position size. That part is straightforward math. Portfolio volatility is not, because it depends heavily on how correlated the holdings are with each other, not just with the market. If they’re weakly correlated, the combined volatility can be meaningfully lower than either one alone, which is the entire mathematical basis for diversification.

This is where evaluating a single stock diverges sharply from evaluating a diversified portfolio. A single high-beta, high-volatility stock might be genuinely risky to hold on its own. The same stock, sized appropriately inside a portfolio of otherwise uncorrelated holdings, might contribute less marginal risk than its standalone numbers suggest. Investopedia’s framing on using beta for risk assessment applies here too: a portfolio can carry an average beta near 1 while still lacking real diversification, if every holding tends to sell off together during the exact market conditions that matter most.
The practical rule: judge individual stocks on their own beta and volatility when deciding whether to buy them at all, then re-judge the portfolio’s aggregate numbers, along with the correlation structure between holdings, before deciding how much of any one stock actually belongs in it.
Investors weighing how concentration affects that risk picture might also find it useful to read about international diversification and the hidden risks it addresses, particularly for portfolios overweight in a single market or currency.
For readers who want to see how position size interacts with sector concentration in practice, MarketCapLens’s sector rotation approach walks through holding a small number of top sectors on a rotating basis, a strategy where both beta and volatility shift meaningfully as sector leadership changes.
Our Take: Use Both, Trust Neither Blindly
Beta and volatility get treated as interchangeable risk labels in too many investing conversations, and that’s a habit worth breaking. They measure different things, and conflating them leads to hedges that don’t hedge and stop losses set on the wrong logic.
Our stance: never read a beta number without glancing at its R-squared, and never trust a volatility figure without knowing whether it’s historical or implied. Both metrics are backward-looking snapshots of a moving target, useful precisely because they’re quantifiable, dangerous the moment you treat them as permanent.
Pull up a few company pages on MarketCapLens and run the numbers yourself across a couple of different windows. The gap between a 90 day beta and a five-year beta on the same stock tends to be the fastest way to internalize why window selection matters more than most investors assume, and for background on how a company’s size itself shapes these numbers, our plain-English guide to market capitalization is a useful next stop.
— MarketCapLens
This article is general information, not a substitute for advice from a qualified financial advisor. Consult a qualified financial professional about your own circumstances before acting on anything here.
Sources
FAQ
Is 1.5 a High Beta?
Yes.
Does Higher Beta Mean Riskier?
Higher beta means more systematic risk, or greater sensitivity to market swings, but it doesn’t capture total risk. A stock can have low beta and still carry high volatility from company-specific events.
Is a Beta of 0.5 Good?
A beta of 0.5 is considered defensive, since it tends to fall less than the market during downturns, but it can also lag during strong rallies. Whether that’s “good” depends on whether your goal is capital preservation or upside capture.
What Does a Beta Value Tell You?
Beta tells you how sensitive an asset’s returns are to movements in a chosen benchmark, expressed as a ratio: a beta of 1.0 means it moves with the market, above 1.0 means it amplifies market moves, and below 1.0 means it dampens them.
How Is Volatility Different from Standard Deviation?
They’re effectively the same calculation in this context. Volatility is typically expressed as the annualized standard deviation of an asset’s returns, so the two terms are usually interchangeable in investing discussions.
Recommended
For informational purposes only and is not investment advice. Do not rely on the facts, figures, ticker symbols, or other statements in this article — they may be incomplete, outdated, or incorrect, and we are not responsible for errors. See our disclaimer.