Blog
P/B 5.0 Explained: Market Cap vs Book Value for Investors
By MarketCapLens · Published · 12 min read

Market cap tells you what the market thinks a company is worth right now. Book value tells you what the accountants say is left over after subtracting every liability from every asset. The two numbers rarely match, and that gap is the whole point: market cap moves with sentiment and growth expectations, while book value moves only when the balance sheet changes. For sizing up a company or comparing it to peers, lean on market cap first; for a liquidation baseline or a sanity check on asset-heavy businesses, book value does the job market cap cannot.
TL;DR:
- Market cap can be inflated or deflated by stock splits, buybacks, and diluted share counts, which may mislead comparisons if not properly accounted for.
- Book value only changes with alterations to assets, liabilities, or impairments, making it more stable but often outdated for reflecting intangible assets.
- High-growth tech firms often trade at large multiples of book value due to intangible assets not reflected on the balance sheet, unlike banks which usually trade near book value.
- A low price-to-book ratio can indicate undervaluation or underlying issues, so it requires cross-checking with earnings trends, debt levels, and sector context before acting.
- Using real-time market cap data paired with recent balance sheets improves comparison accuracy, especially when assessing valuation gaps in different economic conditions.
Marketcaplensmarketcaplens.comCompare Valuation Data With ContextTrack real-time market caps, historic data, and sector breakdowns across more than 2,500 public companies.Explore MarketCapLens
Table of Contents
- Market Cap vs Book Value: How Is Market Capitalization Calculated?
- What Is Book Value and How Do You Calculate It?
- Why Do Market Cap and Book Value Diverge?
- How Do Investors Use the Price-to-Book Ratio?
- What Are the Common Pitfalls When Comparing These Metrics?
- When Should You Rely on Market Cap Versus Book Value?
- MarketCapLens’s Take on Comparing These Two Numbers
- Check the Numbers Yourself Before You Trust Anyone’s Spreadsheet
- Sources
- FAQ
Market Cap vs Book Value: How Is Market Capitalization Calculated?
Market capitalization is current share price multiplied by total shares outstanding, full stop. A company trading at $50 a share with 2 billion shares outstanding has a market cap of $100 billion. That number changes every time the stock trades, which is exactly why it’s called a market-perceived measure rather than a fixed one.
Two things trip people up here. First, corporate actions like stock splits, buybacks, and new share issuances change the share count and therefore the market cap, even when nothing about the underlying business changed that day. Second, analysts often swap in diluted shares outstanding instead of basic shares, since options, warrants, and convertible securities can all turn into common stock later and quietly inflate the real share count.
Market cap earns its keep in a few specific jobs:
- Ranking companies by size (small cap, mid cap, large cap)
- Classifying stocks for index inclusion, since most major indexes use market cap thresholds as entry criteria
- Making fast, apples-to-apples size comparisons across an entire sector
Pro Tip: Check whether a stated market cap uses basic or diluted shares before comparing two companies. A firm with heavy stock-option grants can look smaller than it really is if the count excludes dilution.
For a deeper walk-through of the formula and its quirks, MarketCapLens has a plain-English market cap primer worth bookmarking.
What Is Book Value and How Do You Calculate It?
Book value is total assets minus total liabilities, the number that shows up on the balance sheet as shareholders’ equity. Divide that figure by shares outstanding and you get book value per share, the metric most investors actually compare against share price.
Unlike market cap, book value doesn’t move with the stock ticker. It only shifts when the company’s financial statements change, and three accounting mechanics drive most of that movement:
- Depreciation steadily reduces the recorded value of physical assets like machinery and buildings over their useful life.
- Amortization does the same thing for intangible assets with a defined lifespan, such as patents or acquired customer contracts.
- Impairment charges hit book value in one lump sum when management decides an asset (often goodwill from an acquisition) is worth less than its carrying value.
Book value carries the most weight for asset-heavy businesses, banks, insurers, and any liquidation scenario where you’re asking, “What’s left if everything gets sold off and every bill gets paid?”
Here’s a quick example. Suppose a company reports total assets and total liabilities such that book value is the difference between the two. Dividing that figure by shares outstanding gives book value per share. Compare that to the stock’s trading price and you already have half of what you need for a price-to-book calculation.
Why Do Market Cap and Book Value Diverge?
A software company can trade at ten times its book value while a regional bank trades near or below its book value, and both can be perfectly rational. The gap comes down to what each metric can and cannot see.
Intangible assets are the biggest driver. Brand strength, proprietary algorithms, customer loyalty, and R&D pipelines rarely show up on the balance sheet at anything close to their real economic value, yet the market prices them in constantly. That’s a core reason book value stays anchored in accounting while market cap floats with sentiment. Growth expectations do similar work: investors pay up for a company they believe will earn far more in five years than its current assets suggest, which is why high-growth tech names routinely trade at rich multiples of book value.
Accounting timing creates the opposite kind of gap. Depreciation schedules and historical-cost accounting mean a factory bought in 2010 might sit on the books well below what it would fetch if sold today, understating book value relative to economic reality.
A few patterns show up consistently by sector:
- Technology and software firms often trade at high price-to-book ratios because most of their value sits in intangible assets never captured on the balance sheet.
- Banks and insurers tend to trade closer to book value, since their assets (loans, securities, cash) are already recorded at something close to fair value.
- Industrials and capital-intensive manufacturers sometimes trade below book value during downturns, when the market doubts the company can earn a return above its cost of capital on all that plant and equipment.
Capital structure adds another wrinkle. Two companies with identical operations but different debt loads will show different equity-based ratios even though their underlying businesses are worth the same on an enterprise basis.
Pro Tip: When a stock trades far below book value, check whether the discount reflects genuine investor pessimism about future earnings or simply reflects that the assets are stale, overstated, or about to be written down.
How Do Investors Use the Price-to-Book Ratio?
The price-to-book ratio, or P/B, is share price divided by book value per share (or equivalently, market cap divided by total book value). A P/B of 1.0 means the market is pricing the company at exactly its accounting net worth. Below 1.0, the market is pricing it below that baseline. Above 1.0, and often well above for growth names, the market is paying for something the balance sheet doesn’t capture.
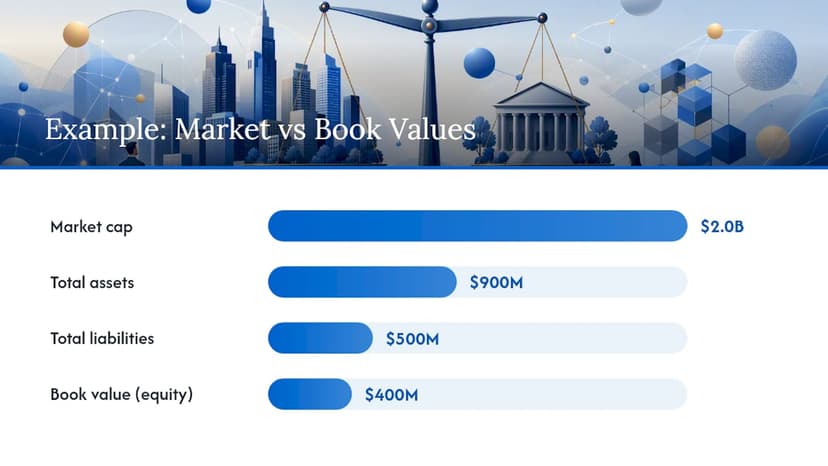
Here’s a worked example. Say a mid-cap manufacturer trades at $40 per share with 50 million shares outstanding. Market cap comes to $2 billion. Its balance sheet shows $900 million in total assets and $500 million in total liabilities, putting book value at $400 million and book value per share at $8.00. Divide the $40 share price by that $8.00 book value per share and you get a P/B of 5.0. The market is valuing this company at five times its accounting net worth, a signal the market expects growth and returns well beyond what the current asset base implies.
A practical workflow for using P/B is to consider how it might shift during different economic phases, including bear markets, when valuations often contract due to investor sentiment.
- Calculate market cap and book value per share independently, using the most recent quarterly filing for the balance-sheet side.
- Divide to get P/B, and compare it against direct sector peers rather than the market as a whole, since typical ratios vary enormously by industry.
- Treat a very low P/B as a research prompt, not a conclusion. It can mean genuine undervaluation, but a persistently wide gap between market cap and book value can also signal structural problems rather than a bargain.
- Cross-check with return on equity (ROE), free cash flow trends, and debt levels before treating a low ratio as a buy signal.
Value investing has long treated market value trading below book value as a hunting ground for bargains, but that same discount has historically also flagged companies with deteriorating businesses heading toward real trouble. The ratio narrows your search. It doesn’t finish the job.
What Are the Common Pitfalls When Comparing These Metrics?
Basic versus diluted share counts cause more comparison errors than almost anything else in this analysis. A company with a large pool of outstanding stock options can look meaningfully smaller on a basic-share basis than it really is once those options get exercised, so analysts typically default to diluted shares when calculating market cap for anything beyond a quick glance.
Off-balance-sheet items create a second layer of distortion:
- Operating lease obligations can represent real financial commitments that don’t always show up as debt on older-style balance sheets.
- Pension deficits at legacy industrial companies can dwarf reported book value once you account for underfunded retirement obligations.
- Unexercised employee stock options dilute future book value per share in ways the current balance sheet doesn’t reflect.
Accounting-policy differences matter too. Companies depreciate assets on different schedules, value inventory with different methods, and time impairment charges differently, so book value comparisons across firms need the same caution you’d apply to any accounting-based metric. When leverage or lease treatment differs substantially between two companies, comparing enterprise value to book value of total capital gives a cleaner picture than a simple equity-based P/B ratio. Book value can also understate a company holding appreciated real estate carried at historical cost, or overstate one sitting on goodwill from an acquisition that hasn’t been written down yet.
When Should You Rely on Market Cap Versus Book Value?
Run through a short checklist before leaning too hard on either number. Check the sector first, since typical P/B ranges for banks look nothing like typical ranges for software firms. Check for recent impairment charges, since a fresh write-down can make book value jump or drop in ways that have nothing to do with operating performance. Check ROE against the cost of capital, check whether the share count used is diluted, and check total debt levels before drawing conclusions from either metric in isolation.
If market cap sits far below book value, three checks come first:
- Review liquidity: does the company have enough cash to meet near-term obligations, or is the discount pricing in bankruptcy risk?
- Check for pending legal or regulatory risk that could explain investor pessimism the balance sheet doesn’t show.
- Look at the earnings trend over the last several quarters. A falling P/B alongside falling earnings is a very different story than a falling P/B with stable earnings.
If market cap sits far above book value, flip the questions:
- Confirm the growth story: are revenue and earnings actually expanding fast enough to justify the premium?
- Identify which intangible assets, brand, patents, network effects, are doing the heavy lifting that the balance sheet can’t price.
- Ask whether current expectations already assume near-perfect execution, since that’s when high-multiple stocks get punished hardest on any stumble.
Pro Tip: Before acting on a P/B outlier, pull up the company’s market cap trend over the past year. A ratio that looks cheap today because the stock just crashed tells a very different story than one that’s been consistently low for years.
Picture an investor who spots a regional bank trading at 0.7 times book value. Instead of buying immediately, they run the checklist: loan-loss provisions look manageable, ROE sits close to the sector average, and there’s no pending litigation. That combination turns a raw discount into an actual thesis, not just a cheap-looking number.
MarketCapLens’s Take on Comparing These Two Numbers
Most of the confusion around market cap and book value comes from treating them as competing answers to the same question. They’re not. Market cap answers “what does the market think this is worth today,” and book value answers “what does the accounting record say is left after debts are paid.” Neither one is more honest than the other; they’re just measuring different things.
Where useful freshness matters, market cap rankings and sector allocations updated multiple times daily across many tracked companies help, because a book-value comparison built on stale share-price data can mislead you the moment the stock moves. Consolidated, current share counts also help reduce the basic-versus-diluted confusion that trips up a lot of manual comparisons. Pairing a real-time market-cap view with a company’s latest balance sheet gives a more current picture than pulling numbers from two different points in time. After running the math yourself, cross-referencing against sector-level market cap data is a fast way to see whether a company’s valuation gap is a company-specific story or an industry-wide pattern.
— MarketCapLens
Check the Numbers Yourself Before You Trust Anyone’s Spreadsheet
Running your own P/B calculation only works if the inputs are current, and share prices move fast enough that yesterday’s market cap can already be stale by lunch. A platform that tracks over 2,500 public companies with rankings, sector breakdowns, and share-price data refreshed multiple times daily can help ensure the market-cap side of your comparison is not built on outdated numbers.

Pull up any company’s market cap and stock price directly, check where it sits against its sector on the rankings page, and pair that with the company’s latest balance sheet to run the book-value math covered above. It takes a few minutes and beats guessing.
Sources
The Investopedia guide to market capitalization covers the core formula and use cases in more depth than any single article can. For the accounting side, the Investopedia piece on market value versus book value walks through book value per share step by step. Readers who want the technical adjustments professionals use, diluted shares, enterprise value, options treatment, should go straight to Aswath Damodaran’s chapter on price-to-book and value-to-book at NYU Stern, which remains one of the most rigorous public treatments of the topic.
This article is general information, not a substitute for advice from a qualified financial advisor. Consult a qualified financial professional about your own circumstances before acting on anything here.
- Market capitalization defined (Investopedia)
- Book Value Vs. Market Value | 2025 Investing Guide (Business Insider)
- Chapter on price-to-book and value-to-book (Aswath Damodaran, NYU Stern)
FAQ
What is better, book value or market value?
Neither is objectively better; they answer different questions. Market cap reflects what investors currently believe a company is worth, while book value reflects the accounting net worth on the balance sheet, and serious analysis uses both together.
Does Warren Buffett think the market is overvalued?
Berkshire Hathaway’s public letters and interviews have periodically flagged pockets of overvaluation, but neither the article’s sources nor a single figure address a current market-wide verdict from Buffett, so treat any specific claim on this with caution.
What happens if book value is greater than market value?
When book value exceeds market cap, the market is pricing the company below its accounting net worth, which can signal undervaluation, but it can also reflect real concerns about earnings power, stale or overstated assets, or looming write-downs.
What is a good price-to-book ratio?
There’s no single “good” P/B ratio since typical ranges vary heavily by sector. Comparing a company’s P/B to its direct industry peers, rather than to the market overall, gives a far more useful benchmark.
How do I quickly compare market cap across companies?
Market cap rankings and sector data updated multiple times daily across thousands of tracked companies can be a practical starting point before pulling a company’s balance sheet for the book-value side of the comparison.
Recommended
For informational purposes only and is not investment advice. Do not rely on the facts, figures, ticker symbols, or other statements in this article — they may be incomplete, outdated, or incorrect, and we are not responsible for errors. See our disclaimer.