Blog
Investors: First Close Pricing Can Shift IPO Market Caps by Billions
By MarketCapLens · Published · 10 min read

IPO market cap equals the share price multiplied by post-issue basic shares outstanding, and most professionals calculate it using the first closing market price rather than the offer price. That distinction alone can change a company’s ranking by billions of dollars. Before comparing any two IPOs, confirm which price and which share count the source actually used.
TL;DR:
- The first close price provides a market-determined valuation and is preferred for comparing IPO market caps, while the offer price is useful for calculating proceeds.
- Accurate measurement of IPO market cap requires the post-issue share count and the chosen valuation date, either the offer price or first close, as they can differ significantly.
- Major IPOs like Alibaba, Meta, and Visa have historically set records based on the first close, but rankings are highly sensitive to which valuation method is used.
- Underwriters set IPO prices using comparable company analysis, discounted cash flow, and precedent transactions, leading to often higher first-day market caps than initial offering prices.
- After initial trading, market cap can change due to greenshoe exercises, secondary offerings, unlocks of restricted shares, or stock options, making initial figures only snapshots of a company’s valuation.
MarketcaplensTrack IPO Market Caps With ContextMarketCapLens brings together market capitalization rankings, real-time prices, historic data, and sector breakdowns for thousands of public companies.Explore MarketCapLens
Table of Contents
- What Is IPO Market Cap and How Is It Measured?
- Offer Price vs. First Close: Which One Should You Use?
- Which IPOs Have the Largest Market Caps?
- How Underwriters Set the Price Before Day One
- Why IPO Market Cap Keeps Changing After the First Trade
- Building a Reliable IPO Market-Cap Dataset
- Why Methodology Transparency Matters More Than the Ranking Itself
- Track IPO Market Caps as They Happen
- Sources
- FAQ
What Is IPO Market Cap and How Is It Measured?
Calculating IPO market cap correctly requires three inputs you can pull straight from public filings and exchange data. Get any one of them wrong and your number will not match what appears on a league table or a research paper.
Here is the step-by-step process:
- Find the post-issue basic shares outstanding. This figure sits in the prospectus, either Form S-1 or the final Form 424 filed with the SEC. It reflects total shares after the offering closes, not the shares outstanding before the deal was priced.
- Choose your price. You can use the offer price (set the night before trading begins) or the first closing market price (where the stock settles at the end of day one). The SEC’s IPO statistics and filings are the primary source for offer price and registration details.
- Multiply price by shares. Offer price × post-issue shares gives you the market cap at pricing. First close × post-issue shares gives you the market cap most academic studies and financial media actually report.
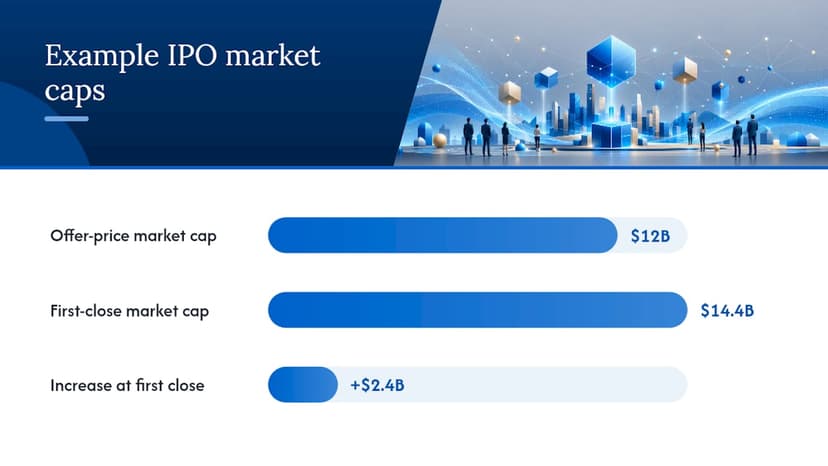
Here’s a simplified example. Say a company prices its IPO at $30 a share with 400 million post-issue shares outstanding. That puts the offer-price market cap at $12 billion. If the stock pops 20% and closes its first day at $36, the first-close market cap jumps to $14.4 billion, a $2.4 billion swing that has nothing to do with new shares being issued.
One wrinkle trips up a lot of first-time analysts: dual-class structures. When a company has untraded or restricted share classes (common in founder-controlled tech IPOs), the standard convention includes those shares at the same price as the traded class, even though they never touch the open market. MarketCapLens breaks down exactly how dual-class shares affect market cap if you want the mechanics behind that assumption.
Offer Price vs. First Close: Which One Should You Use?
The offer price is what underwriters and the issuing company agree on the night before trading starts, based on investor demand gathered during the roadshow. The first closing price is whatever the market decides once shares actually trade, which can diverge sharply from that initial number.
Academic research overwhelmingly favors the first close for a simple reason: it is market-determined rather than negotiated behind closed doors. Jay Ritter’s long-run IPO statistics use first-close pricing as the baseline for calculating returns, since that is the earliest point where public investors, not underwriters, have set the value.
Statistic Callout: IPOs frequently open and close their first trading day well above the offer price. That first-day pop, sometimes called “money left on the table,” is why offer-price market cap and first-close market cap routinely tell two different stories about the same deal.
Here’s when to use which figure:
- Use offer price when you’re calculating proceeds raised for the company or measuring underwriter performance.
- Use first close when you’re comparing an IPO’s market cap against other public companies or building a historical ranking.
- Flag which one a source used before you cite a “biggest IPO ever” claim. Two respectable sources can disagree by billions simply because one used pricing data and the other used day-one closing data.
- Treat mid-quarter or intraday prices as unreliable for ranking purposes. They introduce timing noise that neither convention accounts for.
If you’ve ever seen two outlets report wildly different market caps for the same listing, this is almost always the reason. Neither number is wrong. They are just answering different questions.
Which IPOs Have the Largest Market Caps?
Certain listings dominate the IPO market cap conversation because of sheer scale, not necessarily because they represent typical deals. Renaissance Capital’s league tables track these deals both at pricing and shortly after, which is exactly why the two figures in any ranking rarely match perfectly.
A sample of historically large U.S.-listed IPOs illustrates the pattern:
| Company | Approximate Market Cap Basis | Notes |
|---|---|---|
| Alibaba Group | First close, U.S. listing | Long stood as a benchmark for record IPO size |
| Meta Platforms | First close | Priced amid heavy retail demand |
| Visa | First close | One of the largest financial-sector listings |
| General Motors | First close, post bankruptcy relisting | Government-backed offering |
| Uber Technologies | First close | High offer-price valuation, muted first-day pop |
| Rivian Automotive | First close | Valued ahead of meaningful revenue |
| Meituan | First close, Hong Kong listing | Illustrates non-U.S. exchange scale |
Coverage of the anticipated SpaceX IPO has framed it as a potential record-setter against this exact list, a reminder that “largest IPO ever” is a moving target that gets rewritten every few years.
Notice how a single mega-deal can swing an entire year’s totals, a dynamic explored in insights on why small cap companies may be especially interesting currently. When one company prices at $15 billion and the rest of that quarter’s IPOs average under $1 billion each, headline “total IPO market cap for the year” figures say more about that one listing than about the health of the broader IPO market. Rankings also age fast. Companies get acquired, go private again, or merge, and yesterday’s top-ten list needs constant revision. A table built in 2022 and never updated is already misleading readers.
How Underwriters Set the Price Before Day One
IPO pricing does not happen by guesswork, and understanding the process explains why private valuations and public market caps so often disagree once trading starts.
Underwriters typically lean on three approaches:
- Comparable company analysis, which prices the new stock against similar public peers using multiples like price-to-sales or price-to-earnings.
- Discounted cash flow modeling, which projects future cash flows and discounts them back to a present value, more common for companies with established earnings.
- Precedent transactions, which look at how similar companies were valued in prior IPOs or acquisitions within the same sector.
Book-building ties these methods together. Underwriters gather indications of interest from institutional investors during the roadshow, then set a price designed to clear the deal while leaving some upside for early buyers. That built-in cushion is a major reason first-day pops happen so often, and why first-close market cap frequently beats the offer-price figure.
This also explains why private-market valuations often run higher than IPO market caps once a company actually lists. A late-stage private round often prices in a control premium and values illiquid shares as if a buyer were guaranteed, something public IPO valuation does not carry once shares trade freely.
Pro Tip: When comparing a company’s last private valuation to its IPO market cap, check whether the private round included preferred-share protections like liquidation preferences. Those terms inflate the headline valuation without reflecting what common shareholders would actually receive, which is one reason a “down round IPO” can still be a fair public price.
Why IPO Market Cap Keeps Changing After the First Trade
The market cap you calculate on IPO day is a snapshot, not a fixed number, and several structural mechanics shift it in the weeks and months that follow.
- Greenshoe exercises add shares. Underwriters typically hold an overallotment option, often referred to as a greenshoe, letting them sell up to 15% more shares if demand is strong. Exercising it increases total shares outstanding and, by extension, market cap, even with no price change.
- Follow-on offerings dilute or expand the base. A company raising more capital months after its IPO issues new shares, which recalculates market cap against a larger denominator.
- Restricted shares eventually unlock. Lock-up expirations do not change share counts, but they often trigger price volatility as insiders become free to sell, moving market cap through price rather than share count.
- Options are typically excluded from headline figures. Most published market-cap tables ignore outstanding employee stock options and warrants for comparability, even though a fully diluted count would show a higher number.
Reconciling an exchange-reported market cap against the original prospectus months later often reveals these gaps. If the numbers do not match, check for a greenshoe exercise or a secondary offering first. MarketCapLens tracks what actually moves market cap after listing if you want the fuller mechanics.
Building a Reliable IPO Market-Cap Dataset
Assembling your own IPO rankings requires knowing which sources cover what, since no single feed captures everything cleanly.
- SEC filings (Form S-1, Form 424) give you the authoritative offer price and share counts directly from the company’s registration statements.
- Exchange first-close data provides the market-determined price academic researchers prefer for comparability.
- CRSP and Renaissance Capital league tables offer historical, standardized datasets that most professional researchers cross-reference against raw filings.
- Academic samples, including Ritter’s research files, typically exclude unit offers, ADRs, REITs, and small best-efforts deals to keep comparisons apples-to-apples.
Before trusting any ranking, confirm four things: which price convention was used, whether untraded share classes are included, whether the sample excludes special-case listings, and how recently the table was refreshed. Skip any of those checks and you risk comparing numbers that were never meant to be compared.
Why Methodology Transparency Matters More Than the Ranking Itself
Most disputes over “the biggest IPO ever” are not disagreements about the facts. They are disagreements about methodology that nobody bothered to state upfront. MarketCapLens builds its rankings on post-issue basic share counts and first-close pricing wherever that data is available, matching the convention used in long-run academic IPO research, because it is the version investors can actually reproduce and check.
Real-time market data changes daily, and IPO tables need updates to stay accurate as follow-ons and lock-up expirations reshape share counts. We’d rather you see our methodology and test it against the raw filings yourself than take a ranking on faith.
— MarketCapLens
Track IPO Market Caps as They Happen
Reading about IPO market cap is one thing. Watching it move in real time against thousands of other public companies is another. A live, continuously refreshed ranking platform is available across thousands of companies, so you can see exactly where a newly listed stock lands the moment its first-close price is in.

Start with the Market Cap Rankings to see where recent IPOs rank against established public companies, or check sector breakdowns to see how newly listed companies stack up against peers in the same industry. If you need the fundamentals first, the plain-English market cap guide walks through the core concepts this article builds on. Pull up a recent IPO’s ticker and check its current standing against the rankings today.
This article is general information, not a substitute for advice from a qualified financial advisor. Consult a qualified financial professional about your own circumstances before acting on anything here.
Sources
- Initial Public Offerings: Updated Long-run Statistics (Jay R. Ritter)
- Top 100 US IPOs by Market Cap (Renaissance Capital)
- Initial public offerings (SEC statistics)
FAQ
What Would $10,000 Invested in Google’s IPO Be Worth Today?
Check Alphabet’s current market cap and share price directly for an up-to-date figure, since any static number quoted here would already be outdated.
Who Owns Most of the Stock Market Today?
Institutional investors, including pension funds, mutual funds, and index funds, collectively hold the majority of publicly traded U.S. equity, with individual retail investors owning a much smaller direct share. Ownership concentration varies significantly by company and sector, so a single blanket percentage misrepresents the real spread across different stocks.
What Has Warren Buffett Said About IPOs?
Buffett has long cautioned that IPOs tend to be priced to favor the seller, not the buyer, since the company and its underwriters control the timing and the pricing to maximize proceeds raised. His general advice is to let a newly public company build a trading history before considering an investment, rather than buying at the moment of maximum hype.
What Is the Biggest IPO Valuation on Record?
Alibaba has historically ranked among the largest IPO market caps, though coverage of an anticipated SpaceX offering has floated it as a potential new record holder. The exact ranking depends on whether you compare offer-price valuation or first-close market cap, which is precisely why methodology matters before accepting any “biggest ever” claim.
Should I Use Offer Price or First-Close Price to Compare IPOs?
Use the first closing market price when comparing IPO market caps across companies, since it reflects actual trading rather than a negotiated pre-market figure. Use the offer price only when your question is about proceeds raised by the company, not about how the market ultimately valued the stock.
Recommended
For informational purposes only and is not investment advice. Do not rely on the facts, figures, ticker symbols, or other statements in this article — they may be incomplete, outdated, or incorrect, and we are not responsible for errors. See our disclaimer.