ADR Ratio and Market Cap: How to Get the Math Right
By MarketCapLens · Published · 11 min read
The ADR ratio tells you how many of a foreign company’s ordinary shares sit behind one American Depositary Receipt. It changes the ADR’s price, but it never changes the company’s market cap. To value the company, multiply its total ordinary shares by the price of one ordinary share. Or convert the ADR price back to a per-share price by dividing by the ratio, then multiply by the same share count. Skip that step and you can overstate or understate a company by a factor of 2, 10 or 1,000.
This guide shows the ratio, the formula, a worked example and the checks that keep you out of trouble.
MarketcaplensPut ADR Prices in Market ContextCompare company market capitalizations alongside share prices, historical data, and sector breakdowns to research market trends with more context.Explore company market capsTL;DR
- The ADR ratio is the number of underlying ordinary shares one ADR represents. A 2:1 ratio means two ordinary shares per ADR.
- Market cap is total ordinary shares times the price of one ordinary share. The ratio only converts between an ADR quote and a home-market share price.
- Never multiply an ADR price by the company’s full share count unless the ratio is 1:1.
- A ratio change, like a split of the ADR, changes the ADR’s price and the number of ADRs. It does not change what the company is worth.
- Check the ratio in the depositary bank’s program page or the Form F-6 before you trust any number.
Table of Contents
- What an ADR ratio actually means
- Why the ratio exists
- How the ratio shapes the ADR price
- How to calculate market cap when a company has an ADR
- Does a ratio change affect market cap?
- What to check before you compare an ADR’s market cap with the home value
- Market cap is not the same as enterprise value
- Sizing a position when the ADR ratio muddies the price
- The MarketCapLens perspective
- Check a ratio-based market cap on MarketCapLens
- Frequently asked questions
- Sources
What an ADR ratio actually means
An ADR is a negotiable certificate issued by a U.S. depositary bank. It evidences an ownership interest in American Depositary Shares, which in turn represent an interest in shares of a non-U.S. company held on deposit with a U.S. bank, according to the SEC’s investor education office. In everyday use, people say “ADR” for both the certificate and the share.
The ratio is the link between that U.S. security and the home-market share. Citi’s depositary receipt service explains that an ADR can represent one, more than one, or a fraction of an underlying share. It also reports that current programs range from 100,000:1 to 1:100. That is an enormous spread, and it is why a raw ADR quote tells you very little about company size on its own.
The notation is not always consistent. Many programs write the ratio as ordinary shares to ADR, so a 2:1 ratio means two ordinary shares per one ADR. Some issuers flip it and write ADRs to shares. Always read the sentence the issuer uses, not just the colon.
Common ratio types
| Ratio (ordinary : ADR) | What it means | Effect on ADR price versus one home share |
|---|---|---|
| 1:1 | One ordinary share per ADR | About the same, after currency conversion |
| 2:1 | Two ordinary shares per ADR | About double |
| 10:1 | Ten ordinary shares per ADR | About ten times |
| 1:2 | One ordinary share per two ADRs | About half |
| 1,000:1 | One thousand ordinary shares per ADR | About one thousand times |
The price column is approximate on purpose. It holds only before fees, trading frictions and the time difference between markets.
Why the ratio exists
The depositary bank sets the ratio at a level it expects will appeal to U.S. investors. Investopedia notes that a very high ADR price may deter buyers, while a very low one may make the underlying stock look like a penny stock.
There is an institutional reason too. Ioneer’s ADR program FAQ says ratios are adjusted so the ADR price is relevant to the wider U.S. market, including institutional holders with investment mandate requirements. A stock that trades for a few cents at home would look odd on a U.S. screen, so a bundle of a hundred shares per ADR gives it a more familiar price tag.
This means the ratio is a packaging decision. It is not a signal about quality, valuation or size. A “good” ADR ratio is one that produces a sensible per-ADR price for U.S. investors. Whether the company is a good investment is a separate question.
How the ratio shapes the ADR price
ADR prices follow the home-market price closely because of arbitrage. Investopedia describes that link: if the ADR drifts away from the home price after conversion, traders buy one and sell the other until the gap closes.
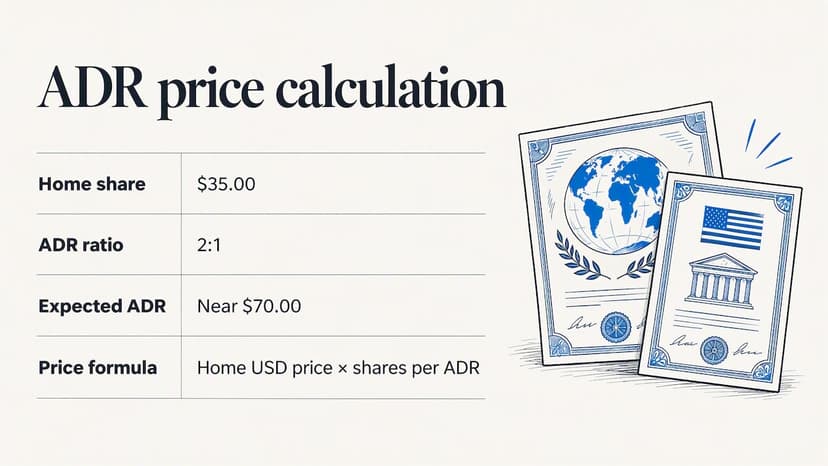
Here is the example from Ioneer’s program FAQ. If a foreign share trades at $35.00 and the ADR ratio is 2:1, the ADR should trade near $70.00. The ratio multiplies the per-share price.
The currency matters as well. Home shares trade in local currency, such as euros, yen or Australian dollars, while the ADR trades in dollars. So the practical formula is:
Expected ADR price = home share price in USD × ordinary shares per ADR
Because the ADR price embeds the exchange rate, ADR holders carry currency risk on top of the company’s business risk. A stock can be flat at home and still move in dollars when the currency moves.
How to calculate market cap when a company has an ADR
Market cap is the market value of all of a company’s outstanding shares: shares outstanding times the price per share. Our own plain-English guide to market capitalization covers the basics. The ADR adds only one wrinkle: you must make sure the price and the share count describe the same unit.
There are two clean routes.
Route 1: use the home share price
- Find total ordinary shares outstanding in the company’s latest annual report or regulatory filing.
- Take the closing price of one ordinary share on its home exchange.
- Convert it into dollars at the same day’s exchange rate if you want a U.S. dollar figure.
- Multiply shares by price.
This is the route most analysts prefer, because the home listing is usually where the bulk of trading happens and the share count is stated in ordinary shares.
Route 2: work back from the ADR price
- Take the ADR price in dollars.
- Divide by the number of ordinary shares per ADR. This gives the implied price of one ordinary share.
- Multiply by total ordinary shares outstanding.
The two routes should land close to each other. A large gap means one of your inputs is stale or wrong: the ratio, the share count or the exchange rate.
A worked example
The numbers below are invented for illustration and describe no real company.
Say a company has 2 billion ordinary shares outstanding. Its ADR trades at $24.00 and each ADR represents 4 ordinary shares (a 4:1 ratio).
- Implied price per ordinary share: $24.00 ÷ 4 = $6.00
- Market cap: 2,000,000,000 × $6.00 = $12 billion
Now the common mistake. Multiply the ADR price by the full share count: $24.00 × 2,000,000,000 = $48 billion. That is four times too large, exactly the ratio. The error scales with the ratio, so a 1,000:1 program would inflate the figure a thousandfold.
The reverse also happens. With a 1:10 ratio (one ordinary share per ten ADRs), the ADR price is a tenth of the share price. Multiplying the ADR price by the share count would understate the company by 90%.
Do not add the ADR on top
A second trap is double counting. ADRs are not extra shares. Each ADR is backed by ordinary shares that the depositary bank holds, so the ADR float is already inside the company’s total share count. Add “ADR shares” to the home count and you count the same stock twice.
The same logic applies to other multi-ticker setups. Our guide to why dual-class tickers get combined walks through how one company can appear under several symbols and still carry a single market cap.
Does a ratio change affect market cap?
No. A ratio change redraws the packaging and leaves the contents alone.
Consider the case of LATAM Airlines. Its new deposit agreement provided for a ratio change from 1:1 to 2,000:1, expected to take effect on or around July 24, 2024. When a change like this happens, the depositary adjusts holders’ positions and the ADR price moves in line with the new ratio. The business, its share count and its total value are the same before and after.
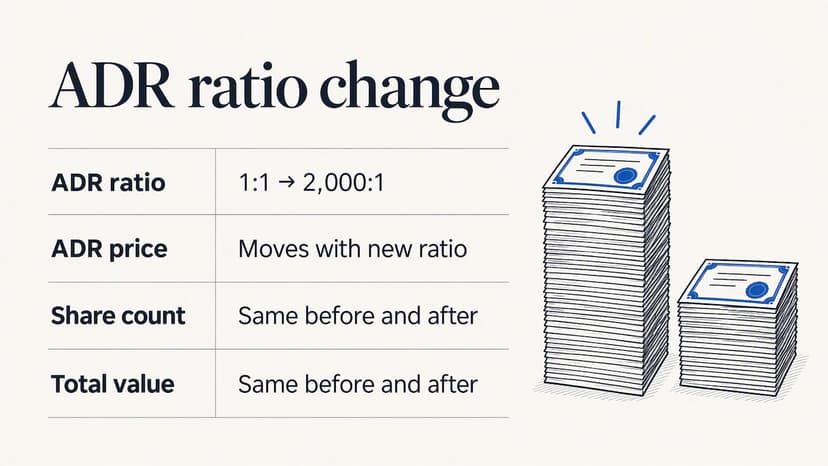
This works like a stock split or reverse split at the ADR level. If you want to see how a split alters price, share count and cost basis while leaving total value unchanged, try our stock split calculator and read what a stock split does to shares and cost basis. Treat a ratio change the same way.
When you review historical ADR prices, adjust for ratio changes first. An unadjusted chart can show a fake crash or a fake spike on the day the new ratio starts, and any percentage-return math built on it will be wrong.
What to check before you compare an ADR’s market cap with the home value
A short checklist keeps the comparison honest.
- The ratio and its direction. Read it from the depositary bank’s program page or the registration filing. Confirm whether it is written as shares per ADR or ADRs per share.
- Share count date. Use the most recent filing. Buybacks, issuance and conversions move the count.
- Share classes. Some foreign companies have more than one class, and the ADR may represent only one. Our guide to verifying an ADR’s market cap with Form F-6 shows how to find the ratio in that filing.
- Currency and timing. Use the same day’s closing prices and exchange rate. Home markets close at different hours than New York, so a small mismatch is normal.
- Dilution. Options, convertibles and warrants can raise the effective share count. See how analysts handle that in our piece on fully diluted market cap.
- Sponsored versus unsponsored. The program type affects who publishes the ratio and how easy it is to find. Sponsored programs have a company-backed program page.
If you are comparing U.S. and global company sizes at a larger scale, our walkthrough on reading U.S. versus global market cap puts these checks in context.
Market cap is not the same as enterprise value
Market cap ignores debt and cash. If you are comparing a foreign company that carries heavy borrowing against one that does not, the equity value will mislead you. Read market cap versus enterprise value before you rank companies on size alone.
Sizing a position when the ADR ratio muddies the price
The ratio also affects how you think about trade risk. Because the ADR price embeds the ratio and the exchange rate, a one-dollar move means different things for different programs. A $1 move on a $70 ADR is a different percentage than $1 on a $7 ADR. Work in percentages, then size your stop and target as a proportion of price. A risk-reward ratio calculation uses exactly that logic: compare the distance to your target against the distance to your stop before you commit capital.
The MarketCapLens perspective
We see the same confusion over and over: a reader pulls an ADR quote, multiplies it by a share count from a different source, and gets a number that is off by exactly the ratio. The ADR price is a real price. It is just a price for a bundle, not for a single share.
Our approach is to keep three things in view at once: the price of the unit you can buy, the number of units that exist, and the currency they are quoted in. When those three line up, market cap becomes simple arithmetic. When one is borrowed from a different unit, the answer is wrong, and it often looks plausible enough to slip through.
That is why we track more than 2,500 listed companies with prices refreshed several times a day, and why we pair rankings with plain-English explanations. A ranking is only useful if the size behind it is computed on a consistent basis. We would rather you check the ratio once and trust the figure than guess.
MarketCapLens
Check a ratio-based market cap on MarketCapLens
When you want a fast answer, start from the numbers you already have. Our market cap calculator multiplies price by shares, so you can test the two routes above with the per-share price and the ordinary share count. Then compare the result with the live market cap rankings to see where the company sits among the world’s largest public companies.
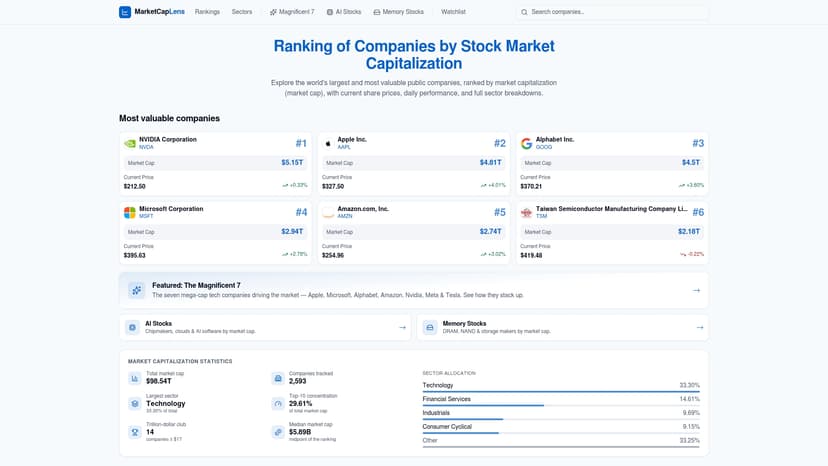
For ADR-listed names, you can look at pages such as Arm Holdings to see how an American depositary share is presented with its market cap and price.
Frequently asked questions
What is a good ADR ratio?
There is no universally good ratio. The depositary bank chooses one that gives the ADR a price U.S. investors find sensible, and a ratio that suits retail buyers and institutions alike is the practical goal. The ratio does not measure quality or value, so judge the company on its fundamentals instead.
How do you calculate an ADR ratio?
Divide the number of ordinary shares by the number of ADRs they back. If 4 ordinary shares back 1 ADR, the ratio is 4:1. You can also back into it by dividing the ADR price (in dollars) by the home share price (in dollars), which should come out close to the ratio. The authoritative figure is in the program documents and the Form F-6.
Does the ADR ratio change a company’s market cap?
No. Market cap equals ordinary shares outstanding times the price of one ordinary share. The ratio only translates between the ADR quote and the home share price, so a ratio change moves the ADR price and ADR count but leaves total value unchanged.
Is it a good idea to buy ADRs?
ADRs give you a way to own foreign companies in dollars on a U.S. market, but they bring currency exposure and company-specific risks. Read the SEC’s investor bulletin on ADRs and check the program type and fees before buying. If your situation is complex, a registered financial adviser can help you decide.
Sources
- Investor Bulletin: American Depositary Receipts (SEC Office of Investor Education)
- Citi Depositary Receipt Services: ADR FAQ
- ADR Conversions (Interactive Brokers)
- ADR Program FAQs (Ioneer)
- American Depositary Receipts (ADRs): Types, Pricing, and Risks (Investopedia)
- LATAM Airlines deposit agreement exhibit (SEC EDGAR)
Recommended
For informational purposes only and is not investment advice. Do not rely on the facts, figures, ticker symbols, or other statements in this article — they may be incomplete, outdated, or incorrect, and we are not responsible for errors. See our disclaimer.