All-Time High Market Caps: Records, Milestones and How to Read Them
By MarketCapLens · Published · 12 min read

The largest all-time high market caps belong to a handful of U.S. technology companies. Nvidia was the first to cross $5 trillion, in October 2025. Apple was the first to reach $1, $2 and $3 trillion. Microsoft held the crown at the peak of the dot-com boom. Records keep moving, so this guide gives you the milestones that matter, the method behind them, and a way to check where any company stands against its own peak today.
Marketcaplensmarketcaplens.comTrack Market Cap Records TodayCompare leading companies by market capitalization and explore current performance, historical data, and sector breakdowns in one place.Explore market cap dataTL;DR
- Market cap is share price times shares outstanding, so an all-time high market cap is a different thing from an all-time high share price.
- Apple reached $1 trillion in 2018, $2 trillion in 2020 and $3 trillion about 16 months later. Nvidia became the first company above $5 trillion in October 2025.
- Before the AI boom, the benchmark was Microsoft at the 1999 peak, which Apple passed in 2017.
- A record needs a rising share price, a stable or shrinking share count, or both. Splits, buybacks and new share issuance all change the math.
- To see whether a company is near its peak today, compare its live market cap with its prior high on a live ranking, not on a news article that may be months old.
Table of Contents
- What an all-time high market cap actually measures
- The milestones that mark each era
- What pushes a company to a record market cap
- How to check if a company is at an all-time high today
- Records by sector
- Common mistakes when reading record headlines
- Our perspective
- Track records as they happen
- FAQ
- Sources
What an all-time high market cap actually measures
Market capitalization is the share price multiplied by the number of shares outstanding. Investopedia gives a simple example: a $30 share price and one million shares imply a $30 million market cap. The same source notes that the figure moves during the trading day with the share price, while the share count changes more slowly, through issuance, employee options or buybacks.
That gives an all-time high market cap two parts:
- The price part. The stock trades at a level the market has never paid before.
- The share part. The company has not diluted the gain with new shares, or has shrunk the count through buybacks.
The two usually move together, but not always. A company can set a record market cap while its share price sits below an earlier peak, if it has issued many more shares since. The reverse is also possible: a stock can hit a new price high while the market cap lags, because the share count fell. Our explainer on market cap vs. stock price walks through why a high share price does not make a company large.
Closing value or intraday peak
Record headlines mix two measures. A company can “touch” a milestone for a few minutes during a session, then close below it. A closing record is the stricter test, because it reflects where the market settled. When you compare records across sources, check which one each source uses. A 0.5% difference can decide whether a headline says “crossed” or “closed above”.
Total shares or free float
Standard market cap uses all shares outstanding. Some index providers use free-float market cap instead, which counts only shares available for public trading and is generally smaller, as the market capitalization overview describes. If you compare a ranking from one provider with another and the numbers differ, this is a common reason. We cover the distinction in shares outstanding vs. float.
The milestones that mark each era
Records in market cap come in steps. Each step shows what the market valued most at that moment.
| Milestone | Company | What it reflected |
|---|---|---|
| $1 billion | U.S. Steel, 1901 | Industrial consolidation |
| $500 billion | Microsoft, 1999 | The dot-com peak |
| $1 trillion | Apple, 2018 | Smartphones and services |
| $2 trillion | Apple, 2020 | Pandemic-era tech rally |
| $3 trillion | Apple, about 16 months after $2 trillion | Continued tech dominance |
| $5 trillion | Nvidia, 2025 | The AI chip buildout |
Each row has a source. Forbes reported that U.S. Steel was the first company to reach a $1 billion market cap, at $1.4 billion when it went public in 1901. The same Forbes piece puts Microsoft as the largest company at the $500 billion milestone in 1999, with Apple becoming the first to hit $1 trillion in 2018. Investopedia states that Apple reached $2 trillion in 2020 and became the first company to reach $3 trillion 16 months later.
Microsoft, 1999: the benchmark of the old era
For nearly two decades, the dot-com peak was the yardstick. Microsoft was the largest company in 1999, and its peak stood as the record for a U.S. public company until Apple overtook it. The New York Times reported that Apple’s closing market cap reached $903 billion on Nov. 8, 2017, surpassing what Microsoft was worth during the dot-com boom. The Times built that comparison from CRSP data covering virtually all publicly traded U.S. companies since December 1925, ranking each company by its highest market cap.
That detail matters for how you read old records. A fair historical comparison ranks companies by their own peak, and a raw dollar comparison over decades does not adjust for inflation or for the overall size of the market. A $583 billion company in 1999 was a far bigger share of the stock market than the same dollar figure would be today.
Apple, 2018 to 2025: three trillion-dollar steps
Apple was the first company to cross each of the first three trillion-dollar marks. It then passed $4 trillion in 2025. AppleInsider reported that Apple’s market cap had closed above $4 trillion for the first time on October 13, 2025, and it touched that level again on October 28 after a rally tied to iPhone 17 demand. You can follow Apple’s current figure and history on its AAPL market cap page.
Microsoft and Apple, January 2024: a changing of the guard
The title of world’s largest company has changed hands. Reuters reported that Microsoft briefly became the world’s largest company in January 2024, at a $2.887 trillion market cap, while Apple stood at $2.875 trillion after a $3.081 trillion peak in December 2023. The gap between first and second place was under half a percent, a reminder that rank at the top can flip in one session.
Nvidia, 2025: the first $5 trillion company
CNBC reported that Nvidia became the first company to cross the $5 trillion market value mark after its shares rose more than 3% on October 29, 2025. At the time, the stock was up more than 50% year to date, and the company had said it expected $500 billion in AI chip orders. The same report noted that the rally had prompted some investors to raise bubble concerns. For a deeper look at how the threshold was reached, this write-up on the $5 trillion threshold covers the AI and chip story in Dutch.
What pushes a company to a record market cap
No single factor makes a record. In the milestones above, the same handful of drivers show up again and again.
- Earnings growth that beats expectations. Prices tend to rise when a company’s profits and guidance beat what analysts had priced in. Apple’s 2025 run followed a strong report on iPhone 17 demand and services revenue, according to AppleInsider.
- A new market that investors believe is large. Microsoft in 1999 and Nvidia in 2025 were both tied to a technology wave, the internet and AI respectively. The market pays for expected growth, not only current profit.
- Shrinking share count. Buybacks reduce shares outstanding, so the same earnings are spread over fewer shares. This lifts price per share and can help market cap.
- Index and fund flows. Companies already large in major indexes get steady buying from funds that track them, which can reinforce a rally.
- Broad market conditions. Falling interest rates, strong economic data and general risk appetite lift most stocks together. A company can set a record market cap simply because the whole market is high.
These are the usual mechanics, not a forecast. A record is a snapshot of what investors paid at one moment, and it says nothing certain about what comes next. That is as true after a record as it is before one.
Stock splits do not create records
A split changes the share price and share count in opposite directions and leaves market cap unchanged. If a company splits 10-for-1, the price falls to a tenth and shares outstanding rise tenfold. When you compare an old price high against today’s price, a split can make a comparison look like a crash that never happened. Our stock split calculator adjusts prices for splits so you can compare like with like.
How to check if a company is at an all-time high today
News articles go stale quickly. A “record” from last quarter may be 15% below today’s level, or 15% above it. Here is a short routine that takes a few minutes.
- Find the current market cap. Open a live ranking and read the figure for your company. Our market cap rankings list the largest public companies and refresh several times a day.
- Find the prior peak. Use the company’s historical data to locate its highest market cap, not its highest share price.
- Adjust for share count changes. If the company has split its stock or issued many new shares, compare market caps and not prices.
- Compare the two numbers. The gap, in percent, tells you how far below the peak the company sits. A company at its peak shows a gap of zero.
- Check the peer group. Look at the sector to see whether the move is company-specific or sector-wide.
If you want to verify a number yourself, the market cap calculator multiplies price by shares in one step. To work backward from a target, such as what share price a company needs to reach a given market cap, use the implied share price calculator.
A worked example
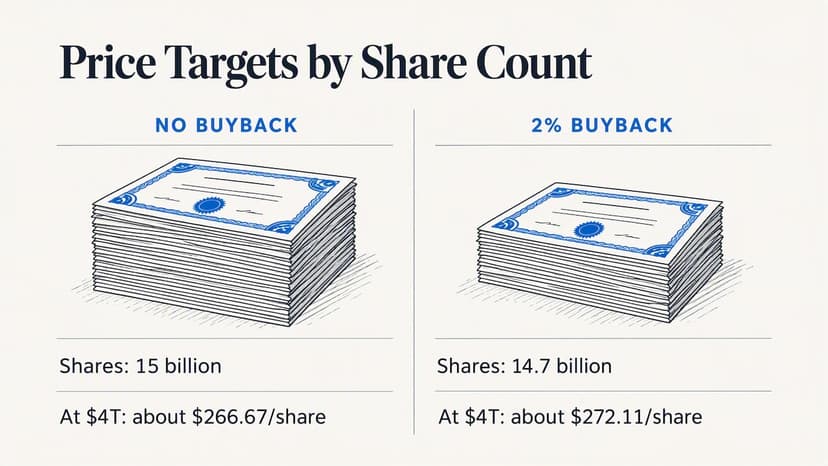
Suppose a company has 15 billion shares outstanding and trades at $200. Its market cap is $3 trillion. To reach $4 trillion with no change in share count, it needs a price of about $266.67, a rise of 33%. If it buys back 2% of its shares in the meantime, leaving 14.7 billion, the same $4 trillion needs a price of about $272.11. The buyback makes the price target higher, not lower, because there are fewer shares to share the value. This is why price and market cap targets need to be calculated together.
Price and market cap also matter when lenders value shares. Banks that offer stock-backed loans look at the value of a position and the market cap behind it, and this explainer on how lenders value shares shows why a falling market cap changes the loan math.
Records by sector
The companies with the biggest peaks cluster in technology, but other sectors have their own record holders and their own cycles. Energy companies typically peak when oil prices spike, as the 2014 and 2022 periods showed. Financial companies tend to peak when credit is cheap and trading is busy. Healthcare names often set highs on drug approvals.
To compare a company against its own sector, use the sector pages:
If you want a quick view of the mega-cap names that dominate the headlines, our featured page groups the Magnificent 7, AI and memory stocks together.
Common mistakes when reading record headlines
Confusing price and size. A $900 stock is not necessarily bigger than a $90 stock. Only the share count tells you which company is worth more.
Comparing across decades in nominal dollars. A trillion dollars meant more relative to the economy in 2000 than it does now. If you want a fair historical comparison, use each company’s share of total market value or adjust for inflation.
Mixing sources. Different providers use different share counts, different timing and sometimes different currencies. A figure that looks 3% off may simply come from a different snapshot.
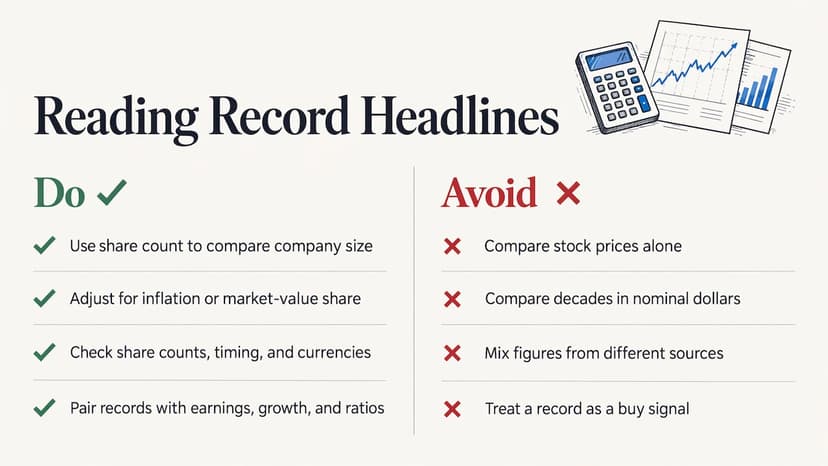
Treating a record as a signal. A record shows that the market valued a company highly at that moment. It does not by itself say the stock is cheap or expensive. Pair it with earnings, growth and valuation ratios, and talk to a licensed financial adviser before you act on any of it.
Our perspective
Most record-market-cap stories are written once and left to age. The number is correct on the day, then wrong a week later. We built MarketCapLens around the opposite idea: a ranking you can come back to.
When we look at an all-time high, we ask three plain questions. What is the company worth right now? What was the highest it has ever been worth? And did the share count change in between? Answering them takes live data on more than 2,500 companies, refreshed several times a day, with sector breakdowns beside the ranking so you can see whether a record is one company’s story or a whole industry’s.
We also think the explanation matters as much as the number. That is why we pair rankings with short, plain-English guides on float, splits and the difference between price and size. Our aim is that you can read any record headline and know in a minute whether it holds up.
MarketCapLens
Track records as they happen
If you want to follow the largest companies without hunting for the latest headline, start with our live market cap rankings. They show current market cap, daily moves and sector breakdowns for more than 2,500 public companies in one place. For your own numbers, the stock calculators cover market cap, splits and implied share prices.
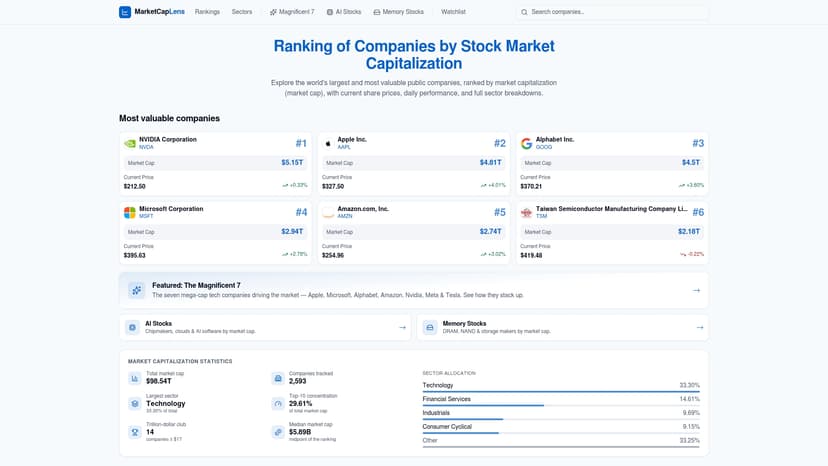
Pick a company you follow, open its page, and compare today’s market cap with its past peak. It takes less than a minute, and it replaces guesswork with a number.
FAQ
Which company has the largest market cap ever?
As of the milestones reported, Nvidia was the first company to cross $5 trillion, in October 2025, according to CNBC. Rankings change daily, so check a live list for the current leader. The top spots have traded between Nvidia, Apple and Microsoft in recent years.
Is an all-time high share price the same as an all-time high market cap?
No. Market cap equals share price times shares outstanding, so the two can diverge when a company splits its stock, issues new shares or buys shares back. For a fair comparison over time, use market cap or split-adjusted prices.
Who was the biggest company in the world in 2000?
Microsoft was the largest company by market cap at the end of the dot-com boom, with its peak around 1999, according to Forbes and The New York Times. Apple passed that peak in 2017, when its closing market cap reached $903 billion.
Is the stock market still at an all-time high?
That changes daily, so no article can answer it for long. Check a live index level and compare it with its previous peak. If you want to know about individual companies, compare each one’s current market cap with its own record using a live ranking.
Sources
- Microsoft topples Apple to become global market cap leader (Reuters via Yahoo Finance)
- Apple Is the Most Valuable Public Company Ever (The New York Times)
- From $1 Billion To $1 Trillion: The Surprising History of Market Cap Firsts (Forbes)
- Market Cap: The Formula Behind Company Valuation (Investopedia)
- Market capitalization (Wikipedia)
- Nvidia becomes first company to reach $5 trillion valuation (CNBC)
- Apple reaches $4 trillion market value (AppleInsider)
Recommended
For informational purposes only and is not investment advice. Do not rely on the facts, figures, ticker symbols, or other statements in this article — they may be incomplete, outdated, or incorrect, and we are not responsible for errors. See our disclaimer.