Blog
MarketCapLens: 0.2% Reset in Equal Weight ETFs for Investors
By MarketCapLens · Published · 9 min read

An equal weight ETF puts the same dollar percentage behind every stock in its index, whether that’s Apple or a company a tenth its size. The main effect: less exposure to mega-cap dominance, more exposure to smaller names, and higher trading costs from constant rebalancing. Use one when you want to bet against concentration, not when you want the cheapest, lowest-maintenance option.
TL;DR:
- Equal weight ETFs rebalance quarterly, which increases trading costs and tax liabilities compared to passive cap-weighted funds.
- This approach reduces concentration risk by giving smaller companies more influence and dilutes the impact of mega-cap stocks.
- Higher turnover from rebalancing can lead to tax costs of 0.2% to 0.8% annually, especially problematic in taxable accounts.
- Equal weight funds tend to outperform during broad market rallies where many sectors contribute, but lag when a handful of tech giants dominate gains.
- When market concentration is high or sector leadership narrows, adding an equal weight position can help diversify and broaden return sources.
MarketcaplensTrack Market Trends With More ContextExplore market capitalization, share prices, sector breakdowns, historic data, and daily performance metrics across thousands of public companies.Explore MarketCapLens
Table of Contents
- What Does “Equal Weight” Actually Mean?
- How Are Equal Weight Indices Built and Rebalanced?
- Equal Weight vs. Cap Weight: What Actually Changes?
- When Does Equal Weighting Actually Pay Off?
- What Do Rebalancing Costs Really Cost You?
- Which Equal Weight ETFs Should You Know?
- How MarketCapLens Sees the Equal Weight Decision
- Where to Verify These Numbers Yourself
- Sources
- FAQ
What Does “Equal Weight” Actually Mean?
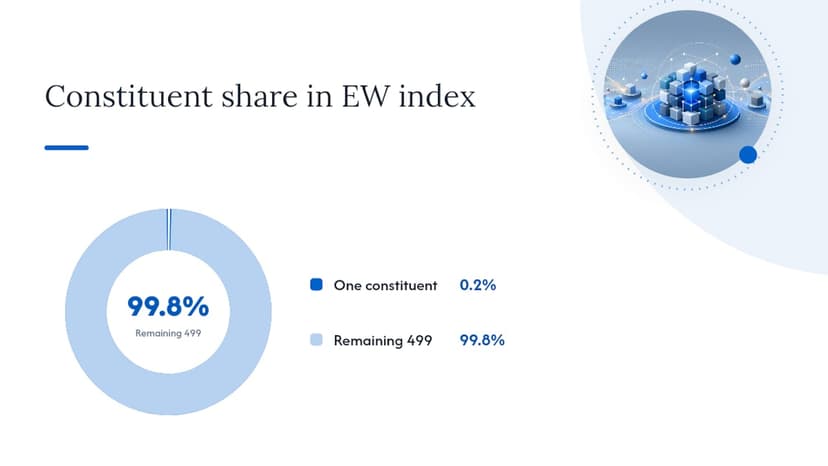
In a 500-stock equal weight index, every constituent starts each rebalance at the same target: 0.2% of the fund. That’s the whole idea. A 500-stock index built this way treats a $50 billion company and a $2 trillion company identically on the day weights are set, which is a sharp departure from how a standard cap-weighted index works.
Here’s the part that trips people up: an equal weight fund and a cap-weighted fund tracking the same universe often hold the exact same stocks. The difference is entirely in the sizing. The S&P 500 Equal Weight Index is the clearest example. It draws from the same 500 companies as the standard S&P 500, but instead of letting Apple, Nvidia, and Microsoft dominate based on their trillion-dollar valuations, it resets every name to roughly 0.2% at each rebalance.
A few things follow from that structure:
- Every constituent carries equal influence on the index’s return, regardless of size.
- Smaller companies in the index get a bigger say than they would under cap weighting.
- The fund’s sector mix can drift away from the broader market’s, since it’s no longer anchored to which sectors happen to have the biggest companies.
How Are Equal Weight Indices Built and Rebalanced?
Equal weight indices don’t stay equal weight on their own. Stock prices move every day, so by the time a quarter ends, some positions have drifted above 0.2% and others below it. The index provider fixes that on a set schedule, and fund managers follow suit.
The mechanics generally break down into three steps:
- Reset: at each scheduled rebalance, every constituent’s weight snaps back to the target percentage.
- Trim and add: names that outperformed since the last rebalance get sold down; names that lagged get bought up.
- Replicate: the ETF adjusts its actual holdings to mirror the freshly rebalanced index, using full replication for a list this size rather than sampling.
The Invesco S&P 500 Equal Weight ETF (RSP) follows exactly this pattern, rebalancing quarterly to restore the 0.2% target across all 500 names.
Quarterly rebalancing, four times a year, means four separate rounds of buying and selling across the entire index — not once, like a passive cap-weighted fund might need after a major reconstitution. That cadence is the root of nearly every cost difference you’ll see later in this piece. More trades mean more transaction costs and, in a taxable account, more realized gains passed through to shareholders.
Equal Weight vs. Cap Weight: What Actually Changes?
Swap the weighting scheme and you get a fundamentally different portfolio from the same stock list, even though the roster hasn’t changed. Concentration, size tilt, turnover, and sector exposure all move.
Concentration is the most obvious shift. In a cap-weighted S&P 500, the ten largest companies can account for a substantial share of the index’s total value, with mega-cap technology names carrying outsized influence. Reset everything to 0.2% and that concentration effectively disappears; no single company can move the needle much more than any other. If you want a sense of how top-heavy today’s index really is, MarketCapLens’s rankings make that concentration visible at a glance, and tracking AI stock market caps shows just how much a handful of names have pulled recent index gains.
Beyond concentration, a few other differences matter for portfolio construction:
- Equal weighting shifts effective exposure toward mid-cap and smaller large-cap names, since size tilts toward companies that a cap-weighted fund would barely notice.
- Sector exposure changes too, because sectors with many mid-sized companies (industrials, materials) gain relative influence versus sectors dominated by a few giants (communication services, technology).
- Alternative weighting schemes generally run higher turnover than cap-weighted funds, since drift correction requires trading regardless of market direction.
- Cap weight tends to win when a small number of mega-caps lead the market higher; equal weight tends to win when leadership broadens across many sectors and sizes.
When Does Equal Weighting Actually Pay Off?
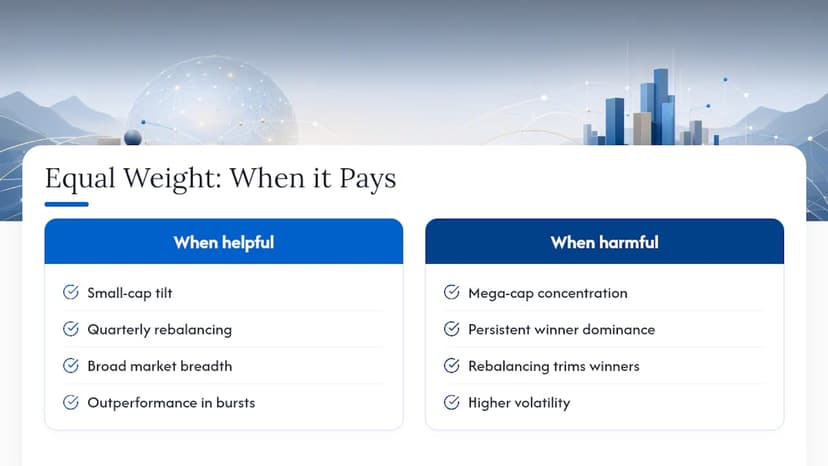
Two forces drive whatever edge equal weight has shown over long stretches: a size tilt toward smaller, historically higher-returning companies, and what’s often called a rebalancing bonus, the mechanical effect of trimming winners and adding to losers every quarter.
That second driver works like a built-in contrarian strategy. Every rebalance forces the fund to sell some of what just went up and buy some of what just went down, which is a repeatable form of the classic “buy low, sell high” behavior most investors struggle to execute manually.
Over long horizons, that combination has produced periods of outperformance versus cap-weighted benchmarks. But the same research is clear about the flip side: when a small handful of mega-cap stocks drive most of the market’s gains, as has happened repeatedly with dominant technology names, equal weight tends to lag, sometimes for several years running.
The rebalancing discipline that helps equal weight in choppy or broadening markets is the same mechanism that hurts it when a few giants just keep winning. There’s no regime where it’s strictly better, only regimes where the trade-off favors it.
The main risks to keep in mind: higher volatility than the cap-weighted benchmark in some periods, tracking error against the index most investors benchmark against, and a tax drag from frequent trading that shows up regardless of whether the fund actually beat the market that year.
Pro Tip: Check a fund’s rolling five-year returns against its benchmark, not just trailing one-year numbers. Equal weight’s advantage tends to show up unevenly, in bursts tied to market breadth, not as a steady annual edge.
What Do Rebalancing Costs Really Cost You?
Quarterly rebalancing isn’t free, and the bill shows up in two places: the expense ratio and something less obvious called the tax-cost ratio, which measures how much of your return gets eaten by taxes on distributed capital gains.
Because equal weight funds trade far more often than cap-weighted ones, they realize more gains along the way. Tax-cost ratios for equal weight funds have run in a range of roughly 0.2% to 0.8% in cited examples, a real drag if you’re holding the fund in a taxable brokerage account.
A few practical moves reduce that bite:
- Hold equal weight funds in a 401(k), traditional IRA, or Roth IRA where realized gains inside the fund don’t trigger a personal tax bill.
- Compare the headline expense ratio against the tax-cost ratio together, not separately. A cheap fund with a high tax-cost ratio can end up more expensive than it looks.
- If you must hold one in a taxable account, weigh the diversification benefit against the annual drag before committing new money.
Which Equal Weight ETFs Should You Know?
The Invesco S&P 500 Equal Weight ETF (RSP) is the largest and most cited example, tracking the S&P 500 Equal Weight Index and rebalancing on the same quarterly schedule described above. It’s the fund most advisors point to first when the topic comes up, and it’s the benchmark against which most other equal weight products get compared.
Beyond RSP, equal weight versions exist for other indices too, including sector-specific equal weight funds and equal weight variants of the Nasdaq 100. If you’re evaluating one for your own portfolio, run through this checklist before buying:
- Underlying index: confirm exactly which benchmark the fund tracks and how often it rebalances.
- Expense ratio: compare it against both the cap-weighted alternative and other equal weight competitors.
- Assets under management and liquidity: a smaller fund can mean wider bid-ask spreads.
- Tracking error: check how closely the fund has followed its stated index historically.
- Tax-cost ratio: look this up on the fund’s own fact sheet or a fund research site before buying in a taxable account.
For funds beyond the well-known names, index provider pages and official fund fact sheets remain the most reliable place to check exact mechanics, since marketing pages tend to gloss over rebalancing detail.
How MarketCapLens Sees the Equal Weight Decision
Deciding whether to add an equal weight sleeve starts with a simple question: how concentrated is the market right now? MarketCapLens tracks market-cap and sector breakdowns across thousands of companies, which makes it straightforward to check what share of total value sits in the top ten names at any given moment.
We’d frame the decision this way: keep a cap-weighted core as your default, and layer in an equal weight allocation when concentration climbs, sector breakdowns show narrowing leadership, or a handful of names are clearly doing the heavy lifting. Watch three things on an ongoing basis: top-10 concentration share, dispersion across sectors, and whether size leadership is broadening or narrowing.
— MarketCapLens
Where to Verify These Numbers Yourself
- S&P 500 Equal Weight Index methodology for the official index construction rules.
- Invesco RSP fact sheet for current holdings, fees, and rebalancing mechanics.
- AAII’s research on equal-weighted fund allocation and the THOR Financial Technologies advisor guide for deeper performance and trade-off analysis.
This article is general information, not a substitute for advice from a qualified financial advisor. Consult a qualified financial professional about your own circumstances before acting on anything here.
Sources
- S&P 500 Equal Weight Index — S&P Dow Jones Indices
- Invesco S&P 500 Equal Weight ETF fact sheet
- Incorporating equal-weighted funds into your allocation — AAII
- ETF weighting matters more than you think — Morningstar
FAQ
Are Equal Weight ETFs a Good Idea?
They’re a good idea for investors specifically trying to reduce concentration risk from a handful of mega-cap stocks, not for someone looking for the cheapest, lowest-turnover option. The trade-off is real: less concentration and more size diversification in exchange for higher turnover and a bigger tax-cost ratio in taxable accounts.
What Is the 7% Rule in an ETF?
This isn’t a standard rule tied to equal weight ETFs specifically; it’s more commonly associated with single-stock concentration caps that some diversified fund structures use to limit any one holding’s weight. Equal weight funds sidestep that concern entirely by capping every constituent at the same target weight from the start, generally around 0.2% in a 500-stock index.
What Are the Disadvantages of Equal Weighting?
The biggest disadvantages are higher turnover, a larger tax-cost ratio (cited in a range of roughly 0.2% to 0.8% for some funds), and periods of underperformance when a few mega-cap stocks drive most of the market’s return. It also tends to run higher volatility and more tracking error against standard cap-weighted benchmarks.
Is VOO an Equal Weighted ETF?
No. VOO tracks the standard cap-weighted S&P 500, meaning its largest holdings by market capitalization carry the biggest influence on returns.
Recommended
For informational purposes only and is not investment advice. Do not rely on the facts, figures, ticker symbols, or other statements in this article — they may be incomplete, outdated, or incorrect, and we are not responsible for errors. See our disclaimer.