IEMG vs VWO: Which Emerging Markets ETF Fits You?
By MarketCapLens · Published · 10 min read
IEMG and VWO are both cheap, broad emerging markets ETFs, and the real difference is the index each one follows, not the fee. IEMG tracks an MSCI index that includes South Korea and small caps. VWO tracks a FTSE index that treats South Korea as a developed market and so leaves it out. VWO charges 0.06% a year and IEMG 0.09%, a gap of $3 a year on every $10,000. Which fund fits you depends on whether you want Korea in your emerging markets slice. The cost gap is a minor factor.
MarketcaplensExplore Emerging Market Company DataCompare market trends, sector allocations, and historical data across thousands of public companies to add context to your ETF research.VisitTL;DR
- Index: IEMG follows the MSCI Emerging Markets Investable Market Index. VWO follows the FTSE Emerging Markets All Cap China A Inclusion Index.
- Cost: VWO’s expense ratio is 0.06% and IEMG’s is 0.09%. On $10,000 that is $6 versus $9 a year.
- Korea: IEMG holds South Korea (17.9% of the fund in its latest semi-annual report). VWO’s FTSE benchmark classes Korea as developed, so it sits outside the fund.
- Pairing: Match the fund to the rest of your portfolio. A FTSE-based developed fund pairs with IEMG so Korea is not missed. An MSCI-based developed fund pairs with VWO so Korea is not counted twice.
Table of Contents
- IEMG vs VWO side by side
- The index is the real difference
- South Korea: why the two funds diverge
- Holdings count and what it means
- Cost: 0.03 percentage points
- Risk: what both funds share
- How to choose between IEMG and VWO
- Looking at IWM vs IJR instead?
- Check the funds against live company data
- Our view
- FAQ
- Sources
IEMG vs VWO side by side
The table below uses each issuer’s own documents. Dates differ because the issuers report on different schedules, so read each row with its date.
| IEMG (iShares) | VWO (Vanguard) | |
|---|---|---|
| Benchmark | MSCI Emerging Markets Investable Market Index (USD) (Net) | FTSE Emerging Markets All Cap China A Inclusion Index |
| Expense ratio | 0.09% | 0.06% |
| Holdings | 2,844 (Nov 12, 2026) | 6,507 stocks (Sept 30, 2026) |
| Fund assets | about $145.5 billion (Nov 13, 2026) | $125.4 billion for the ETF share class (Sept 30, 2026) |
| Inception | October 18, 2012 | March 4, 2005 |
| Distributions | Semi-annual | Quarterly |
| Cap range | Large, mid and small | Large, mid and small |
Sources: iShares IEMG fund page and Vanguard’s VWO fact sheet.
Both funds are large, liquid and passive. Neither is a risky bet on one stock or one country. Both give you a market-cap-weighted slice of the developing world. If you want a refresher on what that weighting means, our guide to market cap weighting walks through it.
The index is the real difference
An index provider writes the rulebook: which countries count as emerging, which companies are eligible, and how they are weighted. Two funds can both say “emerging markets” and still hold different things because their providers disagree.
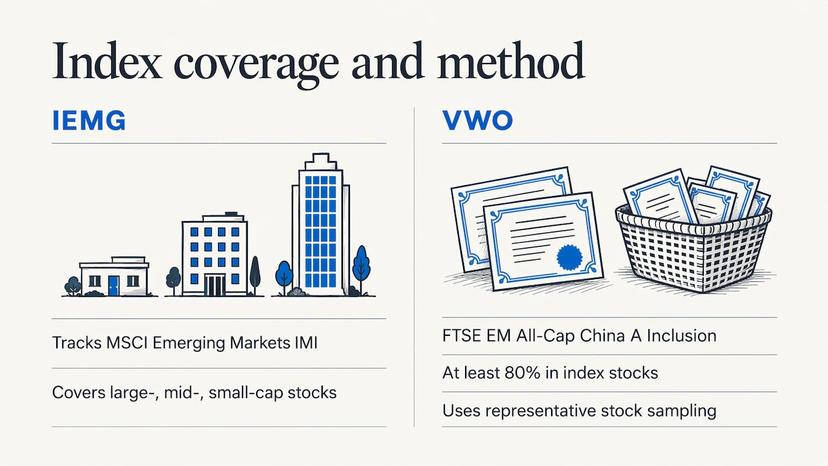
IEMG seeks to track the MSCI Emerging Markets Investable Market Index, which covers large-, mid- and small-cap emerging market stocks. VWO seeks to track the FTSE Emerging Markets All Cap China A Inclusion Index, a market-cap-weighted index of companies located in emerging markets. Vanguard’s prospectus says the fund invests at least 80% of its net assets in stocks of that index. Its fact sheet says it uses passive index sampling, meaning it holds a representative selection rather than every single stock.
We cover how the two index families differ in our piece on MSCI vs S&P methodology. The short version for this pair: the providers draw the emerging markets line in different places, and South Korea is the clearest case.
South Korea: why the two funds diverge
MSCI classes South Korea as an emerging market. FTSE Russell has classed it as developed since September 2009. That one classification choice has large consequences:
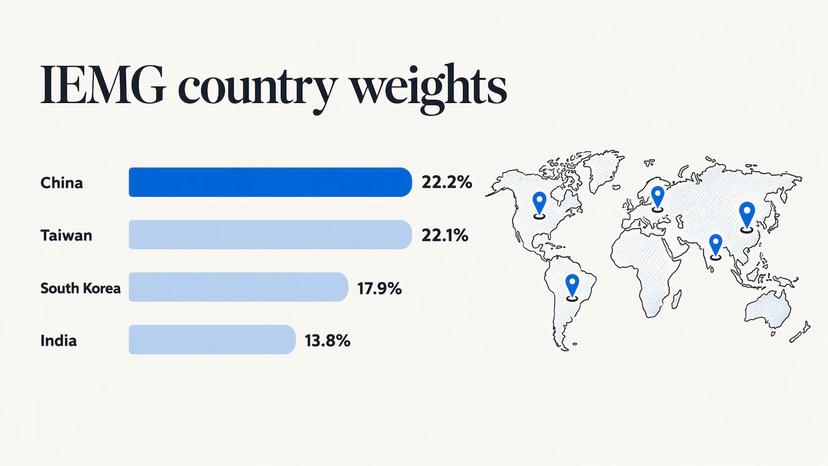
- IEMG holds Korean stocks. Per its semi-annual report for the period ending February 28, 2026, its top countries were China at 22.2%, Taiwan at 22.1%, South Korea at 17.9% and India at 13.8%.
- VWO follows an index in which Korea belongs to the developed bucket, so Korean stocks are not part of its emerging markets exposure.
The effect on the remaining countries is easy to see in a parallel case. S&P Dow Jones Indices, which also classes Korea as developed, shows that as of July 31, 2024 the MSCI Emerging Markets ex China index carried a 16.1% Korea weight, against 0.0% in its own emerging ex-China benchmark. With Korea in, India’s weight fell from 33.7% to 26.5% and Taiwan’s from 28.0% to 24.5%. The same arithmetic applies between IEMG and VWO: leave a large country out and every other weight rises.
Why does Korea matter? Information technology was the top sector in IEMG, at 31.5% in that same semi-annual report, and Korea is a major technology and semiconductor market. If you want that exposure inside your emerging markets fund, IEMG delivers it directly.
Holdings count and what it means
VWO lists 6,507 stocks and IEMG 2,844. The gap looks dramatic, but the two numbers are not measured the same way, and the bigger count is not a better fund. Most of the weight in both funds sits in the same large companies. A long tail of small names adds little to the return or the risk.
What does matter is the shape of the holdings:
- VWO’s equity profile. Vanguard’s investment profile reports a median market cap of $35.4 billion, a price-to-earnings ratio of 16.2x, a price-to-book ratio of 2.5x, a dividend yield of 2.3% and turnover of 5.9%.
- IEMG’s profile. iShares reports a 30-day SEC yield of 1.99% and a 12-month trailing yield of 2.42% (as of October 31, 2026), a 3-year standard deviation of 16.12%, and turnover of 2% in the semi-annual report.
These figures are snapshots. Yields, holdings counts and valuations change as the issuers update them, so treat the numbers as a reading of the date shown and check the fund pages for the latest.
To see how a single large holding or a sector concentrates a fund, you can look up the biggest companies by size on our market cap rankings and compare them with each fund’s top ten. Many of the largest emerging markets names sit in both.
Cost: 0.03 percentage points
VWO’s total annual operating expenses are 0.06%, made up of a 0.02% management fee and 0.04% other expenses. IEMG’s expense ratio is 0.09% in iShares’ product list, and its semi-annual report shows costs of $5 on a hypothetical $10,000 investment over six months, which is 0.09% annualized.
Over a year the gap is:
| Amount invested | VWO at 0.06% | IEMG at 0.09% | Difference |
|---|---|---|---|
| $10,000 | $6 | $9 | $3 |
| $50,000 | $30 | $45 | $15 |
| $100,000 | $60 | $90 | $30 |
That is real money over decades but small next to the year-to-year swings of emerging markets. If you hold IEMG for the Korea exposure, the extra $3 per $10,000 buys you a different slice of the market, not just a different brand.
Trading costs are a separate matter. ETF shares are priced continuously and traded on the secondary market, sometimes at a small premium or discount to net asset value, and your broker may charge to trade. Both funds are large enough that this is rarely a deciding factor. For how ETF structure compares with mutual funds, see our guide to index funds vs ETFs.
Risk: what both funds share
The two funds carry the same kinds of risk. Vanguard’s fact sheet notes that investing in non-U.S. emerging markets securities involves country, regional and currency risks that are especially high in emerging markets. Concentration is part of that. In IEMG, China and Taiwan together made up about 44% of the fund in the February 2026 report, and a single sector, technology, was nearly a third.
The risk is about the asset class, so choosing between these two funds will not remove it. If you want a broader frame on what can go wrong when investing outside developed markets, this overview of the risks of investing in emerging markets covers currency swings, political risk and liquidity from an investor’s angle.
How much should you hold? That is a question for your own plan and, if you have one, your financial adviser. Many investors treat emerging markets as a modest part of a global stock allocation, sized to their time horizon and tolerance for large drawdowns.
How to choose between IEMG and VWO
Start from the rest of your portfolio, not from the fund.
- Check what your developed markets fund uses. If your international developed fund tracks a FTSE index, it likely already holds South Korea, so VWO avoids doubling up and IEMG would add Korea twice. If your developed fund tracks an MSCI index, Korea is not in it, and IEMG fills that gap while VWO would leave Korea out of your portfolio entirely. The pairing question is the one that matters most.
- Decide whether you want Korea as an emerging market. If yes, IEMG holds it directly.
- Weigh the cost. If the first two points leave you indifferent, VWO is $3 a year cheaper per $10,000.
- Consider your account. Both are ETFs and trade like stocks. Check your broker’s commissions and whether you can buy fractional shares.
- Pick one and stay consistent. Holding both adds little diversification, since most of the weight overlaps.
To see how a single global fund handles this question, our comparison of ACWI and all-world ETFs shows the cost and liquidity trade-offs, and VT vs VTI looks at going global versus U.S.-only.
Looking at IWM vs IJR instead?
Those two are U.S. small-cap funds, a different question from emerging markets. IWM tracks the Russell 2000 and costs 0.19%. IJR tracks the S&P SmallCap 600 and costs 0.06%, per iShares’ product list. They are domestic and small-cap only, so they are not substitutes for IEMG or VWO, which hold stocks from emerging markets around the world.
Check the funds against live company data
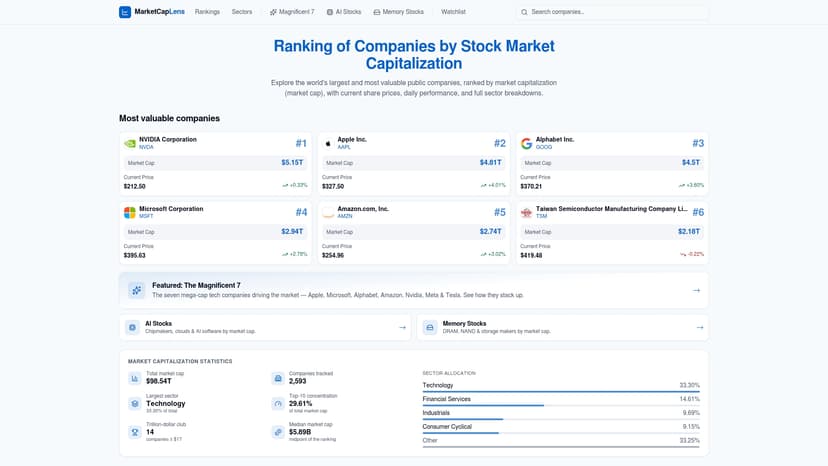
Fund pages tell you what a fund holds. They do not tell you how big or how concentrated the underlying companies are right now. On MarketCapLens you can see where the world’s largest public companies rank by market cap across more than 2,500 tracked companies, with data refreshed several times a day. Use the sector pages to see how technology, financials and other groups stack up, and the stock calculators to work out size and returns on the names you find in a fund’s top holdings.
If you are new to the idea, what a sector is explains how industry groups are formed, which helps when you read a fund’s sector breakdown.
Our view
We look at funds through the companies inside them. An emerging markets ETF is a list of businesses ranked by size, and the two funds in this comparison differ mostly because two index providers rank and classify those businesses differently.
That is why we think the best habit is to look past the ticker. Open the top holdings, see which sectors dominate, and ask whether the weight in each country is what you intended. Market cap weighting means the largest names set the fund’s behavior, so knowing how large they are, and how that changes day to day, is part of owning the fund.
We track more than 2,500 companies with prices refreshed several times daily, with sector breakdowns and history, so you can do that check in minutes. Use it alongside the issuers’ own fund pages, which carry the official figures.
MarketCapLens
FAQ
Is IEMG or VWO better?
Neither is better in general. VWO is cheaper by 0.03 percentage points, and IEMG includes South Korea and holds small caps through an MSCI index. Pick the one that complements your developed markets fund so that Korea is counted once.
Does VWO hold South Korea?
No. VWO follows a FTSE index, and FTSE Russell has classed South Korea as developed since 2009, so it is outside the fund’s emerging markets exposure. IEMG, following MSCI, held South Korea at 17.9% in its February 2026 semi-annual report.
Why does VWO have so many more holdings than IEMG?
The two funds count differently and follow different indexes. VWO reported 6,507 stocks on September 30, 2026, and IEMG 2,844 on November 12, 2026. Most of the weight in each sits in the same large companies, so the count does not change how the fund behaves much.
Can I own both IEMG and VWO?
You can, but they overlap heavily in China, Taiwan, India and Brazil. Holding both adds little diversification and complicates rebalancing. One fund, chosen to fit the rest of your portfolio, is usually enough.
Sources
- iShares Core MSCI Emerging Markets ETF (IEMG) fund page
- iShares Core MSCI Emerging Markets ETF semi-annual report
- Vanguard fund prospectus covering VWO
- Vanguard FTSE Emerging Markets ETF fact sheet
- Vanguard FTSE Emerging Markets ETF investment profile
- iShares U.S. ETF product list
- S&P Dow Jones Indices: A Tailored Measurement of Emerging Markets
- FTSE vs MSCI country classification: Korea and Poland
- Risks of investing in emerging markets
Recommended
For informational purposes only and is not investment advice. Do not rely on the facts, figures, ticker symbols, or other statements in this article — they may be incomplete, outdated, or incorrect, and we are not responsible for errors. See our disclaimer.