Largest Chinese Companies by Market Cap in 2026
By MarketCapLens · Published · 10 min read

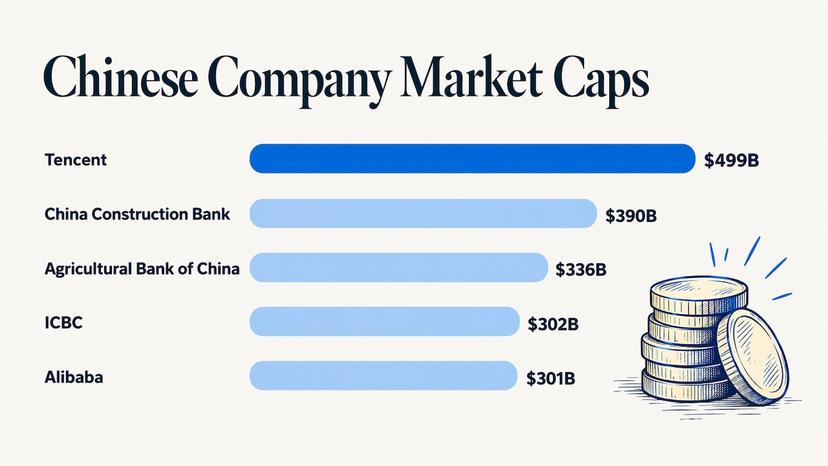
Tencent is the largest Chinese company by market capitalization, at roughly $499 billion in Visual Capitalist’s June 2026 global ranking. Behind it come China Construction Bank, Agricultural Bank of China, ICBC, Alibaba and CATL, all valued at roughly $287 billion to $390 billion. Banks fill much of the list, and the order shifts with share prices, the renminbi and the way a source counts shares. This guide gives the ranking, explains the listings behind it and shows how to read any list of Chinese giants without double counting.
MarketcaplensTrack Chinese Market LeadersCompare company market caps, share prices, historical data, and sector breakdowns across a database of more than 2,500 public companies.Explore company rankingsTL;DR
- Tencent leads China’s market cap ranking, followed by three state-owned banks, Alibaba and CATL, according to a June 2026 global ranking.
- Rankings differ by source and date because of currency moves, share classes and the listing venue used for pricing.
- Many leaders trade in Hong Kong or Shanghai, with ADRs in New York for some. Count each company once.
- Check a figure’s date before you use it. Market cap changes every trading day.
- You can verify any company’s size yourself with a price times shares calculation.
Table of Contents
- The largest Chinese companies by market cap
- What each leader does
- Why two lists of the same companies disagree
- Chinese companies listed in the U.S.
- How to avoid double counting
- China versus the U.S. in scale
- Our perspective
- Track these companies on MarketCapLens
- FAQ
- Sources
The largest Chinese companies by market cap
The table below uses the June 9, 2026 figures from Visual Capitalist’s global ranking, which shows where each Chinese company sits among the world’s biggest. Values are in U.S. dollars and are a snapshot, not a live quote.
| Chinese rank | Company | Global rank | Market cap |
|---|---|---|---|
| 1 | Tencent | 16 | $499B |
| 2 | China Construction Bank | 17 | $390B |
| 3 | Agricultural Bank of China | 18 | $336B |
| 4 | ICBC | 22 | $302B |
| 5 | Alibaba | 23 | $301B |
| 6 | CATL | 24 | $287B |
The source: Visual Capitalist, June 2026. That ranking covers the world’s largest companies, so Chinese names below the top 24 globally do not appear in it. For the rest of the Chinese top 10, the earlier February 2025 ranking is a useful reference for who sits just below. It listed Kweichow Moutai ($251.7B), China Mobile ($220.2B), PetroChina ($202.4B), Bank of China ($201.3B) and Pinduoduo ($161.6B) alongside Tencent, ICBC, Alibaba, China Construction Bank and Agricultural Bank of China. Together those ten were worth $2.6 trillion.
The mix has stayed fairly stable: one internet leader, a block of large banks, an energy major, a telecom operator, a liquor maker and a battery manufacturer. What moves is the order inside the pack. In February 2025 ICBC was second. By June 2026 China Construction Bank had moved ahead of it.
What each leader does
Knowing the business helps you judge why a company sits where it does.
Tencent
Tencent is a technology company whose services include Weixin/WeChat, Tencent Games and Tencent Cloud. According to its own site, Weixin/WeChat has more than a billion monthly active users. That user base, plus games and cloud, is the reason it holds the top spot ahead of the banks. For a sector view, see our list of the largest technology companies by market cap.
The big banks
China Construction Bank, Agricultural Bank of China, ICBC and Bank of China are the financial heavyweights. ICBC is listed on both the Shanghai Stock Exchange and the Stock Exchange of Hong Kong, and its U.S. site described it as the world’s largest bank by total assets, based on 2014 data. Banks tend to hold steady market caps because their earnings are large and predictable, so they cluster in the upper half of any Chinese ranking. Compare them with global peers on our page for the largest financial services companies.
Alibaba
Alibaba Group says it provides technology infrastructure and marketing reach to help businesses engage with customers, and it also provides cloud infrastructure and services. The company has laid out a full-stack AI roadmap covering chips, cloud, models and agents, with a target of more than 20 GW of global data center capacity by 2032. Investors weighing its value are often weighing that AI and cloud story, not just e-commerce.
Kweichow Moutai
Kweichow Moutai’s main business is producing and selling Moutai liquor and related liquors. Its A shares trade on the Shanghai Stock Exchange under code 600519, according to the company’s report. It is the one consumer staples name that regularly sits in the Chinese top 10.
CATL, PetroChina, China Mobile
CATL (batteries), PetroChina (energy) and China Mobile (telecom) round out the industrial, energy and communication names in the top group. If you want to see how they stack up against global rivals, use our pages for industrials, energy and communication services.
Why two lists of the same companies disagree
Open three sources and you will often see three different orders. Four things cause nearly all of it.
1. The date. Market cap is price times shares outstanding, and prices move every session. A ranking published in February and one published in June are describing different markets. Always read the “as of” date before you quote a number.
2. The currency. Chinese stocks are priced in renminbi or Hong Kong dollars, then converted to dollars. A Sina report from November 2026 attributes part of the shift in dollar market-cap leadership to renminbi appreciation. A company can rise in dollar terms with no change in its local share price.
3. The share classes. Many Chinese companies have A-shares in Shanghai or Shenzhen and H-shares in Hong Kong. The same Sina report notes that a fair comparison combines A-share value and H-share value rather than multiplying one venue’s price by total shares. S&P Dow Jones Indices says that companies with multiple share classes are combined to measure total company market capitalization, while index weighting may use float-adjusted market capitalization. FTSE Russell’s rules say the same thing: all share classes count toward full market cap, while only eligible classes count toward index weight.
4. The definition of “Chinese.” S&P’s China universe includes A-shares, B-shares, H-shares, Red Chips, P Chips and Chinese securities listed in the U.S., Singapore or elsewhere. A list built on a narrower universe, such as only mainland-listed shares or only U.S.-listed ones, produces a different top 10.
If you are interested in how ranking rules decide who is on a list at all, this overview of how rankings and leaderboards work shows why eligibility criteria matter as much as the numbers. The same logic applies to index constituents and share-class eligibility.
Chinese companies listed in the U.S.
Most readers in the U.S. meet Chinese companies through American depositary receipts, or ADRs. An ADR is a U.S.-traded receipt representing an interest in a foreign company’s shares. A dual-listing study explains that a Chinese company can trade as H-shares in Hong Kong and as related ADRs in New York. Price differences between the two come from time zones, news, sentiment and market conditions.
The scale of the U.S.-listed group is considerable. The U.S.-China Economic and Security Review Commission reported that, as of March 7, 2025, 286 Chinese companies were listed on NYSE, Nasdaq and NYSE American with a combined market cap of $1.1 trillion. That was up $250 billion from the start of 2024, when 265 companies had $848 billion.
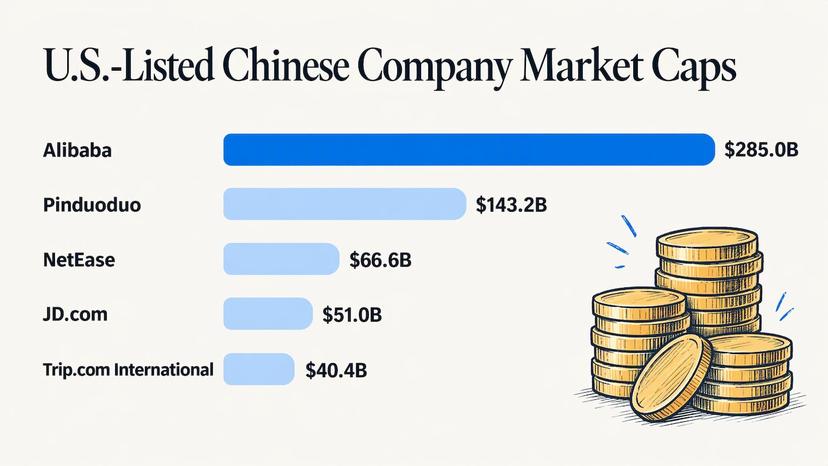
Visual Capitalist used that data for its top 30 U.S.-listed ranking as of April 28, 2025. It was led by Alibaba ($285.0B), Pinduoduo ($143.2B), NetEase ($66.6B), JD.com ($51.0B) and Trip.com International ($40.4B).
Notice what is missing: Tencent, ICBC and the other big banks do not appear in a U.S.-listing ranking, because their main listings are in Hong Kong or mainland China. That is why a “largest Chinese companies” list and a “largest Chinese companies listed in the U.S.” list look so different. Pick the one that matches the question you are asking.
How to avoid double counting
When you build your own list or check someone else’s, follow this routine.
- Count the parent company once. If a company has an A-share, an H-share and an ADR, treat them as one business, not three.
- Use total market cap, not just one venue. Add the value of all share classes, as the index providers do.
- Convert at one date and one exchange rate. Mixing a Hong Kong price from Monday with a Shanghai price from Friday adds noise.
- Note whether the figure is float-adjusted. Index weights use float-adjusted values, which are smaller than full market cap.
- Record the as-of date next to every number.
You can check any single figure with our market cap calculator, which multiplies price by shares. If you only know a target market cap, the implied share price calculator works the other direction.
China versus the U.S. in scale
Putting the Chinese leaders in context: in February 2025, the top 10 Chinese companies totaled $2.6 trillion, against $20.4 trillion for the top 10 U.S. companies, according to Visual Capitalist. Across whole markets in 2025, the U.S. equity market totaled $68.9 trillion versus $15.5 trillion for China. The top of the Chinese market is more concentrated in banks and state-linked firms, while the U.S. top is dominated by technology. For the broader picture, read our top companies by market cap investor rankings.
Our perspective
Market cap looks simple until you try to compare companies across borders. A Chinese giant can have a Shanghai line, a Hong Kong line and a New York receipt, and each one prints a different price at a different hour. The honest way to rank is to treat the company as one entity, date every number and say which universe you are drawing from.
That is how we build MarketCapLens. We track more than 2,500 listed companies, refresh data several times a day, and pair rankings with sector breakdowns so you can see not only who is biggest, but where the weight sits. For China, that means you can see that banks cluster at the top, that one internet platform leads them, and how those names sit against global peers in each sector.
We also explain the terms in plain English, because a ranking you cannot interpret is just a list. Use the sector pages to move from a headline number to the industry context behind it.
MarketCapLens
Track these companies on MarketCapLens
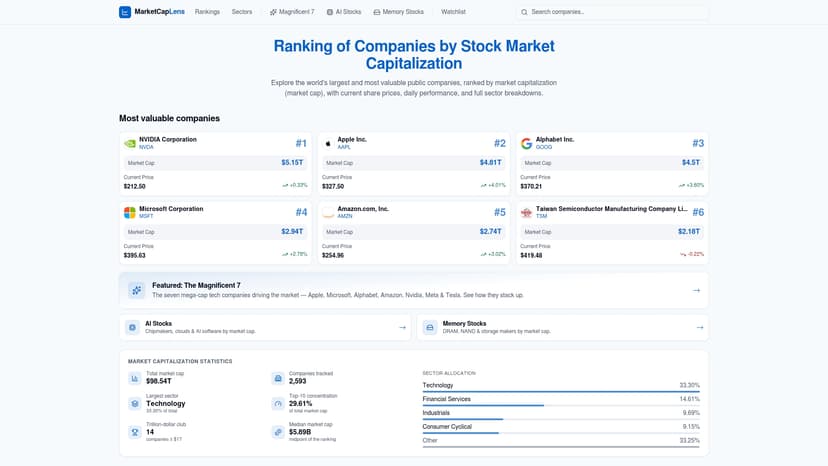
If you want the live version of this list, our market cap rankings show share prices, daily performance and sector breakdowns for more than 2,500 companies, refreshed multiple times a day. You can sort by sector, compare against global peers and look at historic data without piecing together several sources.
For a hands-on check, open the stock calculators to work out size, value and returns. To understand why a high share price does not mean a large company, read market cap versus stock price.
FAQ
What is the largest company in China by market cap?
Tencent. In Visual Capitalist’s June 9, 2026 ranking it held a market cap of $499 billion, ranking 16th among the world’s largest companies. China Construction Bank was next among Chinese names at $390 billion. Check the date on any figure, because the order can change.
Is Alibaba the biggest Chinese company listed in the U.S.?
Yes, by market cap it led the U.S.-listed group in Visual Capitalist’s April 2025 ranking at $285.0 billion, ahead of Pinduoduo at $143.2 billion. Alibaba also trades in Hong Kong, so its overall value counts all of its share classes.
Why do Chinese market cap lists differ between websites?
The main causes are the as-of date, currency conversion, and whether a source combines A-shares, H-shares and ADRs into one company value. S&P and FTSE Russell both count all share classes when measuring a company’s full market cap, so lists that do not follow that approach can show different numbers.
Can U.S. investors buy the largest Chinese companies?
Some trade in the U.S. as ADRs, which are U.S.-traded receipts for foreign shares. Others, such as Tencent and the big banks, have their main listings in Hong Kong or mainland China. Your brokerage’s available markets and the company’s listing structure decide what you can access, so confirm with your broker.
How is market capitalization calculated?
Multiply the current share price by the number of shares outstanding. For companies with several share classes, add the value of every class. Our market cap calculator does the multiplication for you.
Sources
- Visual Capitalist: America’s Biggest Companies Are Bigger Than Entire Regions
- Visual Capitalist: Ranked: 10 Largest Companies in the U.S., Europe, and China
- Visual Capitalist: Ranked: Top 30 Chinese Companies Listed in the U.S.
- U.S.-China Economic and Security Review Commission: Chinese Companies Listed on Major U.S. Stock Exchanges
- S&P China Indices Methodology
- FTSE China 50 Index Ground Rules
- Sina: renminbi appreciation and Hong Kong share structure
- Law of One Price and Arbitrage on China’s Dual-listings
- Tencent
- Alibaba Group
- Alibaba Group: About Alibaba
- Kweichow Moutai report
- ICBC U.S.
Recommended
For informational purposes only and is not investment advice. Do not rely on the facts, figures, ticker symbols, or other statements in this article — they may be incomplete, outdated, or incorrect, and we are not responsible for errors. See our disclaimer.