Largest UK Companies by Market Cap: The Top 5 and How to Read the Ranking
By MarketCapLens · Published · 10 min read
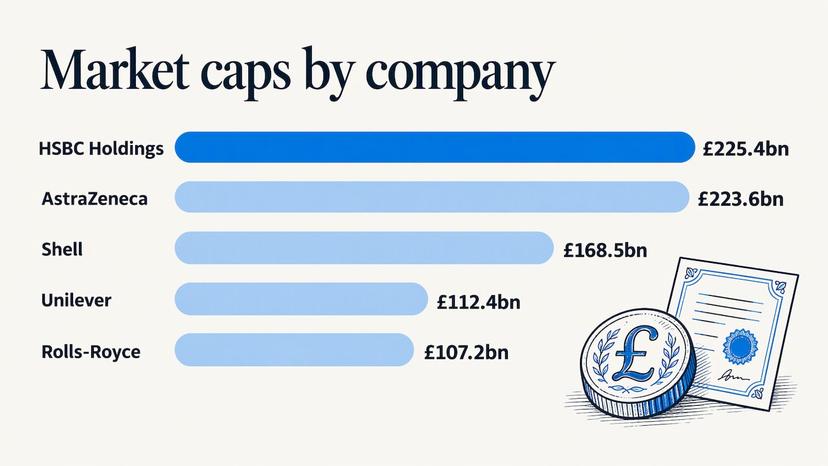
The largest UK companies by market capitalization are HSBC Holdings, AstraZeneca, Shell, Unilever and Rolls-Royce Holdings. HSBC and AstraZeneca trade places at the top depending on the date and the data provider. The order below them moves with every share price update. Market cap is a live number, so the best way to use any list is to understand what it measures and then check the current figures yourself.
This guide gives you the top of the ranking with sourced figures, the sectors that dominate the UK market, and the reasons two lists of the “biggest UK companies” rarely match. It is written for investors, analysts and finance students who need to read a UK ranking correctly, not just copy one.
Marketcaplensmarketcaplens.comTrack Market Caps Across CompaniesExplore company rankings, share prices and sector breakdowns to follow market performance and compare how leading firms fit into broader trends.VisitTL;DR
- The UK’s five largest listed companies by market cap are HSBC, AstraZeneca, Shell, Unilever and Rolls-Royce Holdings, in that order in the most recent index snapshots we cite below. Shell and AstraZeneca swap places in some broader indexes.
- Market cap equals share price times total shares outstanding, so the ranking changes whenever prices move.
- Finance is the largest sector in the broad UK market, at 27% of the Cboe UK All Companies index in September 2026, followed by consumer non-cyclicals, energy, healthcare and industrials.
- A “largest UK companies” list built on revenue, headcount or private ownership will look different from a market cap list. Know which one you are reading.
- UK stocks are priced in pounds sterling, so a dollar-based investor sees currency moves layered on top of share price moves.
Table of Contents
- The largest UK companies by market cap
- What a company’s market cap actually measures
- What sits behind the top five
- Sector weights: what the UK market is made of
- Why two UK rankings rarely match
- How to build a UK ranking you can trust
- Where to track the ranking day to day
- Our perspective
- FAQ
- Sources
The largest UK companies by market cap
Two primary sources give a clean picture of the top of the UK market. The first is the exchange operator ICE, whose Mini FTSE 100 product document gives market caps for the FTSE 100, the index of the 100 largest companies on the London Stock Exchange. As of 31 January 2026, the five largest were:
| Rank | Company | Market cap (31 Jan 2026) | FTSE 100 weight |
|---|---|---|---|
| 1 | HSBC Holdings | £225.4 billion | 8.93% |
| 2 | AstraZeneca | £223.6 billion | 8.25% |
| 3 | Shell | £168.5 billion | 6.54% |
| 4 | Unilever | £112.4 billion | 4.29% |
| 5 | Rolls-Royce Holdings | £107.2 billion | 4.15% |
The second source is the Cboe UK All Companies index, which covers a wider set of 395 constituents. Its September 2026 factsheet lists the top five by weight as HSBC Holdings (9.97%), Shell (7.54%), AstraZeneca (7.30%), Rolls-Royce Holdings (4.59%) and Unilever (3.79%). The same factsheet puts the total index market cap at £2,820,335 million and the largest single constituent at £261,206 million.
Read the two tables side by side and a few things stand out.
The same five names appear in both. The top of the UK market is stable in membership even when the order shifts.
The gap between first and second can be tiny. In the January snapshot, HSBC led AstraZeneca by about £1.8 billion, under 1% of either company’s value. A single trading day can reverse that.
Position four and five swap. Rolls-Royce has a higher weight than Unilever in the September factsheet, while Unilever sits ahead of it in the January document. Different dates, different prices, different ranks.
For a live view of any of these names, the HSBC market cap and stock price page on MarketCapLens shows the current figure for the company that anchors the UK ranking.
What a company’s market cap actually measures
Market capitalization is the total value the stock market places on a company’s equity. The U.S. Securities and Exchange Commission’s investor education site defines it as the current public market price of one share multiplied by the total number of outstanding shares.
A simple illustration, with made-up numbers: a company with 2 billion shares outstanding trading at £10 per share has a market cap of £20 billion. If the price rises to £10.50, the market cap becomes £21 billion. Nothing about the business has to change for the ranking to move. Only the price needs to.
That is why market cap is a different yardstick from the others you may see attached to the phrase “largest companies”:
- Revenue or turnover counts annual sales. A supermarket or an oil major can top a revenue list while sitting lower on market cap.
- Employees counts headcount. Retailers and outsourcing firms lead these lists.
- Market cap counts what investors collectively pay for the equity today. It reflects expected profits, growth and risk, not just current size.
If you are screening for investments, benchmarking a peer group or sizing a sector, market cap is usually the right measure. If you are studying a company’s footprint in the economy, revenue or employment may serve better. Decide before you read a list.
To run the arithmetic on any company yourself, the market cap calculator multiplies price by shares and is useful for checking a figure you saw elsewhere.
What sits behind the top five
What the leaders do tells you what the UK market is. The five names span four industries.
HSBC Holdings is a global bank. It reports in US dollars, and its Q3 2026 results showed profit before tax of $10.0 billion and revenue of $18.7 billion, both excluding notable items, along with a third-quarter dividend of 10 US cents per share. A UK-listed company that reports in dollars is a good reminder that “UK company” describes where the shares are listed and where the group is headquartered, not where its customers or earnings are.
AstraZeneca is a pharmaceutical group, part of the healthcare weighting. Shell is an integrated energy company. Unilever sells consumer goods, which index providers classify as consumer non-cyclicals. Rolls-Royce Holdings makes engines and power systems and sits in industrials.
That spread is why the UK market is often described as defensive and value-oriented compared with the technology-heavy US market. It is worth testing that against the sector data rather than assuming it.
Sector weights: what the UK market is made of
The Cboe UK All Companies factsheet for September 2026 reports these sector weights:
| Sector | Weight |
|---|---|
| Finance | 27% |
| Consumer Non-Cyclicals | 14% |
| Energy | 13% |
| Healthcare | 12% |
| Industrials | 12% |
Those five sectors together account for 78% of the index. The average constituent is worth £6,631 million, according to the same factsheet, while the largest is £261,206 million. That is roughly 39 times the average, which tells you the market is top-heavy: a handful of giants carry a large share of the total.
Three takeaways for an analyst or student:
- Concentration matters. When the top five carry around a third of an index, their share price moves dominate index performance. Look at weights, not just constituent counts.
- Sector exposure is the real story. A UK index fund is substantially a bet on banks, energy, healthcare and consumer staples. Technology, the largest US sector, is not among the top five here.
- Cyclicality differs by sector. Finance and energy respond to interest rates and commodity prices, while consumer staples and healthcare tend to follow different drivers. A concentrated top five can mix those influences.
If you want to compare UK sector leaders with their global peers, MarketCapLens ranks companies by sector: see the lists for financial services, energy, healthcare and industrials. For the logic of how sectors are defined and why classifications differ, the guide to what a sector is is a good starting point.
Why two UK rankings rarely match
You will find several lists called “largest UK companies”, and they disagree. Most of the differences come from a short set of choices.
The date and the price used
A ranking is a photograph. One compiled at the close on a Friday and one at the open on Monday can have different orders, especially where gaps are small, as with first and second place above. Always note the date on any table you use, and treat figures as the published number for that day.
The universe of companies
The FTSE 100 holds 100 companies, the Cboe UK All Companies index holds 395, and other lists cast wider or narrower nets. A company can be among the largest UK companies by market cap and still be missing from an index because of listing venue, share class or eligibility rules. Index weights also differ from raw market cap because indexes often adjust for the shares actually available to trade. That is why HSBC’s weight differs between the two indexes above even though its market cap is one number.
What counts as a UK company
Some lists define it by where the shares are listed, others by where the company is incorporated or headquartered, and others by where it earns its revenue. A group with a London listing and global operations may appear on one list and be excluded from another. Check the methodology note before comparing.
Currency
UK shares are quoted in pounds sterling, but some lists convert everything to dollars, and some companies report in dollars to begin with. A ranking converted at a different exchange rate can reorder close neighbors. If you hold UK stocks from a US account, the exchange rate is part of your return too. A piece on managing currency risk for UK holdings explains how sterling exposure affects the value of positions for non-UK investors.
Share counts
Market cap depends on the number of shares outstanding. Buybacks, new issues and different share classes change that figure, and data providers update the count on different schedules. Two providers can use the same price and arrive at different totals.
How to build a UK ranking you can trust
If you need a clean top-ten for a report, a class project or a screen, follow a repeatable routine.
- Pick the universe. Decide whether you want the FTSE 100 or a broader set, and write that down.
- Pick the date and the currency. Use closing prices from one day and one currency throughout. Convert only once.
- Compute market cap yourself on a spot check. Take price times shares outstanding for two or three names and compare them with the table you are using. The market cap calculator does this in seconds.
- Sort and label. Present the result with the date, the currency and the definition of “UK company” in the caption.
- Add sector context. Group the results by sector so the reader sees concentration, not just a list of names.
That routine takes a few minutes and protects you from the most common error in this topic: comparing numbers that were measured on different terms.
Where to track the ranking day to day
For investors who want a live view rather than a monthly snapshot, a market cap tracker is the practical tool. MarketCapLens follows more than 2,500 listed companies, refreshes its data multiple times daily and breaks results down by sector, so you can see how the largest names in a sector compare and how their weight shifts through the day. Start from the main market cap rankings and drill into a sector or a single company page.
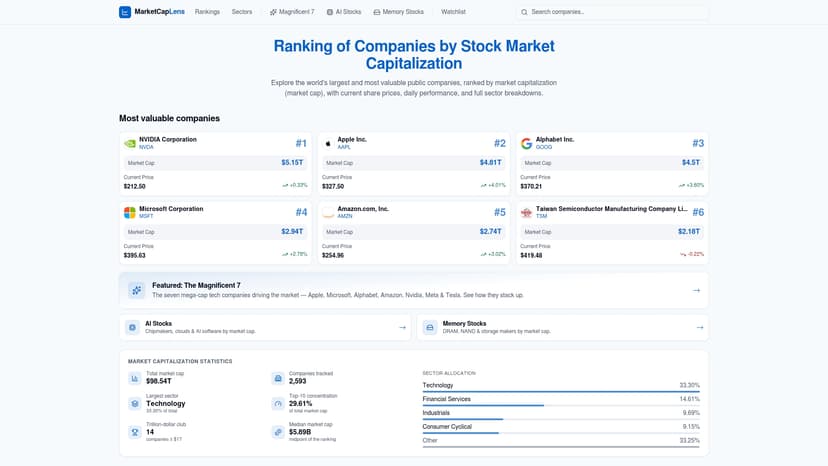
If you are a student or analyst, the sector pages and the stock calculators are built for the questions in this article: how big is this company relative to its peers, which sector does it belong to, and how does its value compare with last week’s.
Our perspective
Most UK rankings are read as if they were permanent. They are not. A market cap list is a price multiplied by a share count, and both numbers change.
The better question is not who is first today but how concentrated the market is and which sectors carry it. The UK’s top five span banking, pharmaceuticals, energy, consumer goods and aerospace, and that mix explains much of how the market behaves.
We built MarketCapLens around that view: a ranking of more than 2,500 public companies, refreshed multiple times a day, with sector breakdowns and historical data alongside the headline number. A single list tells you who is big. Seeing sectors, price history and relative size together tells you why it matters, and we explain the terms in plain English so a student and a professional can work from the same page.
MarketCapLens
FAQ
What is the largest UK company by market cap?
In the two most recent index documents we cite, it is HSBC Holdings. It led the FTSE 100 on 31 January 2026 with £225.4 billion and carried the highest weight in the Cboe UK All Companies index in September 2026. AstraZeneca is close behind in the FTSE 100 snapshot, so the top spot can change on any trading day.
How is market cap different from revenue?
Market cap is the share price multiplied by the number of shares outstanding, which is how the SEC’s investor site defines it. Revenue is what a company earns from sales in a year. A company can have large revenue and a modest market cap, or the reverse, because market cap reflects investor expectations about the future.
Why do different lists of the biggest UK companies disagree?
The usual causes are the date of the prices, the set of companies included, the definition of a UK company, the currency used and the share counts. Check the date and method before comparing two lists. Close neighbors such as first and second place can swap on a single day.
Which sectors dominate the UK market?
Finance is the largest, at 27% of the Cboe UK All Companies index in September 2026. Consumer non-cyclicals follow at 14%, then energy at 13%, with healthcare and industrials at 12% each, according to the index factsheet.
Sources
- Mini FTSE 100 Index futures and Daily Index options, ICE (31 January 2026)
- Cboe UK All Companies Index factsheet (September 2026)
- Market Capitalization, Investor.gov
- HSBC Group corporate website
- Brexit currency risk and hedge ratios for UK treasuries
Recommended
For informational purposes only and is not investment advice. Do not rely on the facts, figures, ticker symbols, or other statements in this article — they may be incomplete, outdated, or incorrect, and we are not responsible for errors. See our disclaimer.