Market Cap Drawdowns: How to Measure, Compare and Recover
By MarketCapLens · Published · 12 min read

A market cap drawdown is the percentage drop in a company’s total stock market value from its highest point to a later low, before a new high is reached. The formula is (trough value − peak value) ÷ peak value. If a company’s market cap falls from $500 billion to $300 billion, the drawdown is −40%, and the company then needs a gain of about 67% just to get back to its old peak.
This guide shows how to calculate that number, why a market cap drawdown can differ from a share price drawdown, how to read depth, duration and recovery together, and how to compare companies, sectors and indexes fairly.
Marketcaplensmarketcaplens.comPut Drawdowns in Market ContextCompare market trends, historical data and sector allocations across more than 2,500 public companies with data updated multiple times daily.Explore market dataTL;DR
- A market cap drawdown is the peak-to-trough decline in a company’s market value, shown as a percentage: (trough − peak) ÷ peak.
- Recovery math is lopsided. A 50% loss needs a 100% gain to break even, and a 30% loss needs about 43%.
- Market cap moves with both share price and share count, so buybacks and new issuance can make a market cap drawdown differ from a price drawdown.
- Depth, duration and recovery tell different stories. Maximum drawdown alone shows only the single worst loss.
- To compare drawdowns across companies, use identical dates, the same observation frequency and one recovery rule.
Table of Contents
- What a market cap drawdown actually measures
- How to calculate a market cap drawdown, step by step
- Why market cap drawdowns can differ from price drawdowns
- The recovery math: why losses hurt more than gains help
- Depth, duration and recovery: three numbers, not one
- How to compare drawdowns across companies, sectors and indexes
- Perspective
- Putting drawdown analysis to work
- Track drawdowns with MarketCapLens
- FAQ
- Sources
What a market cap drawdown actually measures
Market capitalization is the total value of a publicly traded company’s outstanding common shares. You get it by multiplying the market price per share by the number of shares outstanding, as the standard reference definition puts it. If you want the basics first, our plain-English guide to market capitalization covers them.
A drawdown is the percentage decline in an asset’s value from its previous high. The maximum drawdown (MDD) is the deepest peak-to-trough decline before a new high is reached, as investment references define it. Put the two together and a market cap drawdown tells you how much of a company’s total equity value disappeared between its best day and its worst day since.
Three points make the measure useful:
- It is anchored to a peak. A stock that is down 20% over the past month may be only 5% below its all-time high, or it may be 60% below it. The drawdown tells you where the stock stands relative to its best level, not relative to last week.
- It is path-dependent. Two companies can end a year at the same market cap and have very different drawdowns along the way.
- It ignores the direction you expected. It is a record of what happened, which makes it a clean way to see how much pain holders of a stock actually sat through.
How to calculate a market cap drawdown, step by step
The calculation is a simple percentage change between the peak value and the trough value, and the same formula applies to a company’s market cap: (trough value − peak value) ÷ peak value.
- Pick the window. Decide the period you are studying: a year, five years, or the company’s full listed history.
- Find the peak. Identify the highest market cap in that window.
- Find the trough after the peak. The low must come after the peak. A low that happened before the peak is not part of this drawdown.
- Apply the formula. Subtract the peak from the trough, divide by the peak, and express the result as a percentage.
- Track recovery. Note the date the market cap climbs back to the old peak, if it ever does.
A worked example
Take a hypothetical company, which we will call Company A. This is an illustration, not real data.
- Peak market cap: $500 billion
- Trough market cap: $300 billion
- Drawdown: ($300B − $500B) ÷ $500B = −0.40, or −40%
If the company later rebounds to $450 billion, it is still 10% below its peak, so the drawdown has not ended. It ends only when the market cap reaches a new high above $500 billion.
You can check the inputs with our market cap calculator, which multiplies price by shares, and compare the current figure with a past peak.
Why market cap drawdowns can differ from price drawdowns
Market cap changes with the share price and with the number of shares outstanding. New share issues, employee stock options and buybacks can all change the share count. That is why a company’s market cap drawdown and its share price drawdown are not always the same number.
Here is another hypothetical case. A stock falls 40% from its peak. Over the same period, the company buys back 5% of its shares.
- Price: 0.60 of its peak
- Shares outstanding: 0.95 of the peak count
- Market cap: 0.60 × 0.95 = 0.57, a drawdown of −43%
The price fell 40%, but the market cap fell 43%, because buybacks shrank the share count. Issuance works the other way: a company that issues new shares while its price slides may show a market cap drawdown shallower than the price drawdown.
In the simple case where the share count does not change, the two match. Our piece on why price changes and market cap changes match in percentage terms walks through that logic, and what makes a company’s market cap go up or down covers the other drivers.
Splits are not drawdowns
A stock split changes the price and the share count in opposite directions, so market cap stays the same. If you look only at an unadjusted price chart, a 2-for-1 split looks like a 50% crash. It is not. Always use split-adjusted prices or work directly in market cap. Our explainer on why stock splits leave market cap unchanged shows the SEC’s own treatment, and the stock split calculator lets you test the numbers.
Float, dual-class shares and the market cap you use
The market cap figure itself depends on which share count you use. Some providers count all shares outstanding, while index methodologies often weight by the shares available to the public. The difference is explained in shares outstanding vs. float. Companies with several share classes add one more wrinkle, covered in how dual-class shares are combined into one market cap. Pick one definition and stay with it for the whole drawdown calculation.
The recovery math: why losses hurt more than gains help
The most important thing a drawdown number tells you is how hard the climb back is. A larger loss requires an even larger gain to return to the original value. For example, a 50% loss requires a 100% gain to get back to even.
The formula for the gain needed is 1 ÷ (1 − drawdown) − 1. Here is the full table:
| Drawdown | Gain needed to recover |
|---|---|
| −10% | +11.1% |
| −20% | +25.0% |
| −30% | +42.9% |
| −40% | +66.7% |
| −50% | +100.0% |
| −60% | +150.0% |
| −70% | +233.3% |
| −80% | +400.0% |
| −90% | +900.0% |
The curve gets steep quickly. Going from −30% to −50% sounds like a 20-point difference, but the required recovery more than doubles, from about 43% to 100%. This is why professionals care so much about limiting the deepest losses and why a stock that has fallen 80% is a very different proposition from one that has fallen 30%.
Depth, duration and recovery: three numbers, not one
Maximum drawdown is popular because it is easy to understand. But it is one number, and it captures only the largest loss, not how often losses occur or how long recovery takes. To describe a drawdown properly, record three things:
- Depth: how far the market cap fell from the peak, as a percentage.
- Duration: how long the fall took, and separately how long the recovery took. Many analysts measure peak to trough, then trough to a new high.
- Recovery: whether the old peak was ever regained.
Two companies can both show a −35% maximum drawdown. One may have dropped over six weeks and recovered in four months. The other may have bled for three years and never come back. The headline number is identical, but the experience of holding them is not.
What large samples of stocks show
Long-run data on individual stocks is sobering. A 2025 Morgan Stanley study of 6,500 stocks over 1985 to 2024 found a median drawdown of 85% that took about 2.5 years from peak to trough. The same research indicated that approximately 54% of stocks never return to their prior peak after a maximum drawdown.
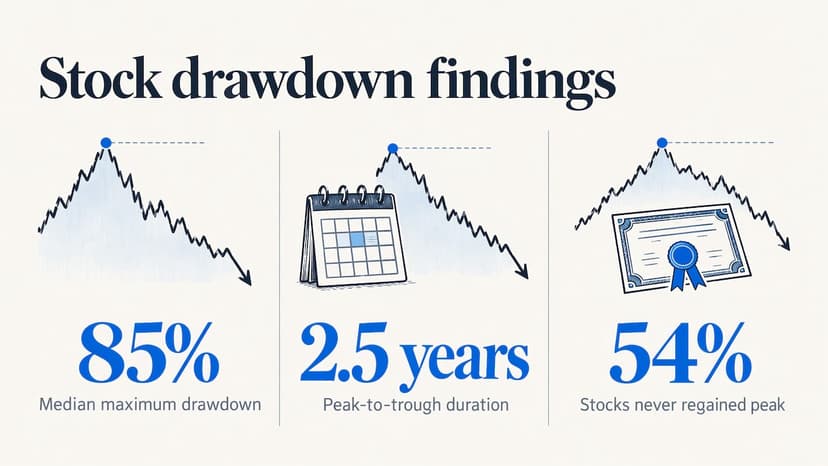
Two lessons follow. First, large drawdowns are part of the normal cost of long-term equity investing, a point the same research makes. Second, “it will come back” is not a plan. For a single company, recovery is common but not guaranteed, which is why position sizing and diversification matter more than any single drawdown figure.
How to compare drawdowns across companies, sectors and indexes
A comparison is only as good as its setup. Before you put two drawdown figures side by side, confirm that both use the same:
- Start and end dates. A window that includes a major market low will always look worse than one that does not.
- Price basis. Check whether dividends are included and whether prices are split-adjusted.
- Observation frequency. Daily data captures intraday-to-close swings that month-end data smooths away, so the daily drawdown is usually deeper.
- Duration counting. Decide whether duration means peak to trough, or peak to full recovery.
- Recovery rule. Define what counts as recovered: touching the old peak, or closing above it.
A quick example of why this matters: a drawdown computed from month-end values can look milder than one computed from daily closes for the very same stock, because the worst day often falls between month-ends.
Comparing companies of different sizes
A percentage drawdown is size-neutral, which makes it good for comparing a $20 billion company with a $2 trillion one. But dollar amounts tell a second story. A −30% drawdown at a mega-cap erases far more absolute value than the same percentage at a small company. Looking at both, the percentage and the dollars lost, gives the full picture. You can browse companies by size on our market cap rankings and see how the largest names are grouped in the Magnificent 7, AI and memory stock lists.
Comparing sectors
Sectors behave differently in downturns. A sector’s market cap is the sum of its members, so a sector drawdown reflects both price moves and the weight of its biggest constituents. When one or two giants dominate a group, the sector drawdown mostly tracks them. Use the sector rankings to see which companies carry the most weight before you read a sector figure as broad-based.
Drawdown versus volatility
Volatility measures how widely returns swing around an average. Drawdown measures how far you fell from a high. A stock can be volatile without a deep drawdown, and it can have a deep drawdown through a slow, steady slide. They answer different questions, and risk work usually needs both. We compare the two measures and the thresholds investors watch in drawdown vs. volatility.
Perspective
We built MarketCapLens around a simple idea: a ranking is only half the story. Knowing that a company is the third largest on the list tells you where it stands today. Knowing how far it sits below its own peak tells you how it got there and what the road back looks like.
Market cap is the right unit for that kind of analysis because it measures what shareholders collectively own, not just what one share costs. It reflects the share count, so buybacks, issuance and splits are already in the number. That is why we track thousands of companies by market cap and refresh the data multiple times a day, so a drawdown reading reflects where the market is now and not where it was last week.
Our approach is to pair the number with context: sector breakdowns, historical ranges and plain-English explanations of what moves a company’s value. A drawdown figure with no context can mislead. A drawdown figure next to the sector, the size and the share count history is something you can reason with.
MarketCapLens
Putting drawdown analysis to work
Here is a practical routine you can follow with any stock or sector.
- Find the peak and the current market cap. Start from the company’s page or the rankings and note both values.
- Compute the current drawdown. Use the formula and record the percentage.
- Compute the gain needed to recover. Use the table above. A stock sitting 45% below its peak needs about an 82% gain to get back.
- Check the share count. If shares outstanding changed a lot, see whether the drawdown reflects price or dilution.
- Compare with peers. Put the figure next to companies of similar size in the same sector, using the same dates.
- Revisit your position. If you are adding shares at lower prices, the stock average cost calculator shows how your break-even price changes, and the stock profit calculator shows your gain or loss.
That last step connects a market-level number to your own account. The break-even for you is not the old peak. It is your average cost, which may be well below the peak if you bought during the decline.
Reading a drawdown without overreacting
A deep drawdown is not a buy signal, and a shallow one is not a safety signal. It is a description of what has already happened. Use it to ask better questions: Did revenue fall, or did only the valuation multiple shrink? Did the share count rise? Is the whole sector down? A company that fell 50% when its entire sector fell 50% is in a different position from one that fell 50% while peers rose.
If you are making decisions about your own savings, particularly around retirement accounts or concentrated positions in one stock, a fee-only financial adviser or a registered investment adviser can fit these numbers to your time horizon and tax situation.
Track drawdowns with MarketCapLens
Our platform tracks more than 2,500 public companies, ranks them by market capitalization and refreshes data multiple times each day, so you can see where a stock stands against its peers, its sector and its own history.
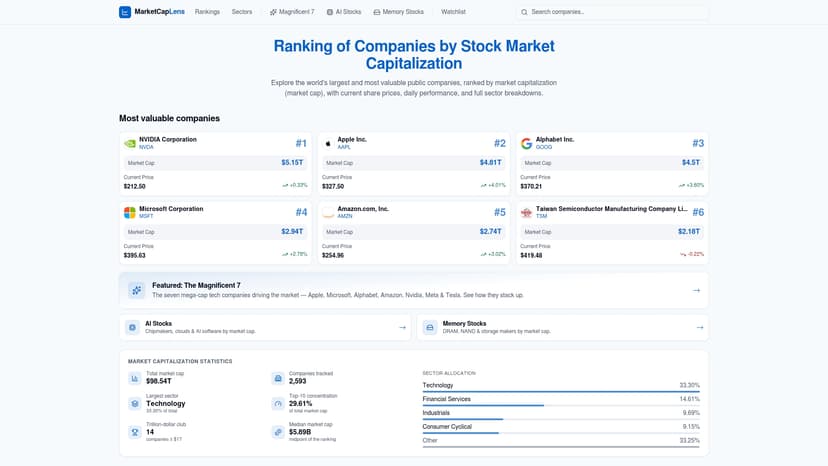
Start with the market cap rankings for the full list, or open the stock calculators to test the numbers on a position of your own. Each company page pairs the current market cap with the stock price, so you can compare today’s value with a past peak.
FAQ
What does a drawdown in stocks mean?
A drawdown is the decline from a previous high to a later low, shown as a percentage. If a stock peaks at $100 and falls to $70, the drawdown is 30%. It lasts until the stock makes a new high above $100.
How is a market cap drawdown different from a price drawdown?
Market cap equals price times shares outstanding, so it moves with both. When the share count is unchanged, the two drawdowns are the same. If a company buys back or issues shares, or changes its share structure, the market cap drawdown can be deeper or shallower than the price drawdown.
How much does a stock need to gain after a drawdown?
The required gain is 1 ÷ (1 − drawdown) − 1. A 30% loss needs a gain of about 43%, and a 50% loss needs a 100% gain. The deeper the loss, the faster the required gain climbs, which is why limiting the worst losses matters.
Do stocks always recover from a drawdown?
No. Research on 6,500 stocks found that about 54% never returned to their prior peak after their maximum drawdown. Index-level recoveries are different from single-stock recoveries, so diversification changes the odds considerably.
Is maximum drawdown enough to judge risk?
No. It shows the single largest loss but not how often losses happen or how long recovery takes. Pair it with drawdown duration, recovery time and a volatility measure for a fuller picture.
Sources
- Market capitalization (definition)
- Understanding Maximum Drawdown (MDD)
- Market Cap: The Formula Behind Company Valuation
- FINRA comment letter on complex investment products, May 2022
- Drawdowns and Recoveries: Base Rates for Bottoms and Beyond (Morgan Stanley Investment Management)
- Drawdowns and Recoveries (Morgan Stanley Investment Management, PDF)
Recommended
For informational purposes only and is not investment advice. Do not rely on the facts, figures, ticker symbols, or other statements in this article — they may be incomplete, outdated, or incorrect, and we are not responsible for errors. See our disclaimer.