3 Rules Investors Use to Read Market Cap and Avoid Traps
By MarketCapLens · Published · 9 min read

Market capitalization equals a company’s current share price multiplied by its total outstanding shares. It’s the fastest way to gauge how big a company is in the eyes of the market, and investors use it to size up risk, sort stocks into peer groups, and build diversified portfolios. A $500 billion company and a $500 million company face very different risks even if their stock trades at the same price, and market cap is what exposes that gap.
TL;DR:
- Market cap reflects investor sentiment and can change quickly from stock price fluctuations or corporate actions like buybacks and offerings.
- Accurate market cap depends on the most recent shares outstanding data, best verified through SEC filings, not stale or aggregated sources alone.
- Market cap categories range from micro- to mega-cap, with larger caps generally offering stability and smaller caps providing growth opportunities accompanied by higher risk.
- Comparing companies solely by share price is misleading, as identical prices can correspond to vastly different market sizes, emphasizing the importance of size metrics.
- Pair market cap with profitability or enterprise value metrics to gain a clearer picture of a company’s financial health and investment potential.
Table of Contents
- What Is Market Cap and How Do You Calculate It?
- Market-Cap Segments: Mega, Large, Mid, Small, and Micro
- What Moves Market Cap: Price Swings and Corporate Actions
- How Investors Actually Use Market Cap (and Where It Falls Short)
- Worked Examples: Doing the Math Yourself
- Where to Find Reliable Market-Cap Data
- MarketCapLens’s Take: Using Market Cap Without Getting Fooled by It
- See Live Market Caps and Rankings Right Now
- Sources
What Is Market Cap and How Do You Calculate It?
The formula is simple: market cap = current share price × total shares outstanding. That’s it. No adjustments for debt, no revenue multipliers, no guesswork. Investor defines it exactly this way, and it’s the standard used across every major exchange and brokerage platform.
Two terms matter here. “Shares outstanding” means every share currently issued and held by anyone, including company insiders and institutions. “Free float” is a narrower number: shares actually available for public trading, excluding restricted stock held by executives or long-term insiders. Most market-cap figures you see quoted use total shares outstanding, but some index providers weight by float instead, which is why the same company can show slightly different cap figures depending on the source.
Here’s the math in action. Say a company trades at $40 a share and has 10 million shares outstanding. Its market cap is $400 million.
- Share price: $40
- Shares outstanding: 10,000,000
- Market cap: $40 × 10,000,000 = $400,000,000
Pro Tip: Never trust a market-cap figure without checking the shares-outstanding number behind it. A stale share count from a quarter-old data feed can throw the calculation off by billions on a large company.
For real numbers, SEC EDGAR is the authoritative source for official shares-outstanding disclosures, since every public company must report that figure in its quarterly and annual filings. Live share prices come from exchange feeds, brokers, or aggregators like MarketCapLens, which pulls both numbers together so you don’t have to cross-reference two sources every time you want a current figure.
Market-Cap Segments: Mega, Large, Mid, Small, and Micro
Wall Street doesn’t treat all companies the same, and market cap is the main sorting tool. FINRA uses market cap to group companies into size buckets, and while exact cutoffs shift slightly depending on who’s drawing the line, the general framework looks like this:
- Mega-cap: a very large market value, typically the largest public companies that dominate major indexes like the S&P 500.
- Large-cap: companies with a large market value, often forming the bulk of major indexes like the S&P 500.
- Mid-cap: roughly $2 billion to $10 billion. Often faster growing than large-caps, with more volatility.
- Small-cap: about $300 million to $2 billion. This is Russell 2000 territory, and it tends to swing harder in both directions.
- Micro-cap: companies with the smallest market value, often characterized by low trading volume and wider bid-ask spreads.
Investors typically lean on large- and mega-cap stocks for stability and dividend income, while mid- and small-caps get bought for growth potential, accepting more volatility in exchange. Micro-caps carry the highest risk and the least analyst coverage, which is exactly why they can also produce the biggest surprises, good or bad.
What Moves Market Cap: Price Swings and Corporate Actions
Market cap changes constantly because both halves of the formula can move independently. A rising stock price pushes market cap up even if the share count never changes. But share count itself isn’t fixed either, and corporate decisions can swing it dramatically overnight.
- Earnings surprises and guidance changes. A beat or miss on quarterly results moves the stock price immediately, and market cap follows.
- Macro shifts. Interest rate changes, inflation data, or sector rotation can lift or drag an entire group of stocks at once.
- Buybacks. When a company repurchases shares, outstanding share count drops, which can lift market cap per remaining share even if the total market cap stays flat.
- Secondary offerings. Issuing new shares dilutes existing holders and increases the share count, which can pressure the stock price down.
- Stock splits. A split multiplies share count and divides price proportionally, so market cap itself shouldn’t change, though investor perception sometimes shifts anyway.
- M&A activity. Acquisition rumors or announcements often cause sharp, fast repricing.
- Delistings. A stock pulled from an exchange effectively zeroes out its tradable market cap.
None of this touches the company’s balance sheet directly. FINRA notes that market cap reflects investor sentiment and market perception, not a full accounting measure. Debt and cash sit outside the formula entirely, which is the single biggest thing new investors misunderstand about the number.
How Investors Actually Use Market Cap (and Where It Falls Short)
Market cap earns its keep in a few specific jobs. It’s a fast screening tool for filtering stocks by size before digging into fundamentals. It’s the backbone of cap-weighted indexes like the S&P 500, where bigger companies pull more weight on the index’s overall movement. And it’s a quick way to compare two companies in the same industry without pulling a full financial statement.
- Screening: filter a watchlist by size before applying other criteria.
- Portfolio construction: balance large-cap stability against small-cap growth potential.
- Index weighting: understand why a handful of mega-caps can move the entire S&P 500 on their own.
- Peer comparison: size up two companies in the same sector at a glance.
But market cap has real blind spots. It ignores debt and cash entirely, which is why analysts often prefer enterprise value, calculated as market cap plus debt minus cash, when comparing companies with very different balance sheets. It also says nothing about profitability or margins. A company with a $10 billion market cap and heavy losses looks identical, cap-wise, to a $10 billion company generating steady profit.
That’s where complementary ratios come in. The price-to-sales ratio divides market cap by trailing twelve-month revenue, and it’s especially useful for companies that aren’t profitable yet, since price-to-earnings doesn’t work when earnings are negative. A market cap that looks large relative to revenue often signals the market is pricing in aggressive growth expectations, while a modest cap against steady revenue can point toward an undervalued stock if the underlying business is healthy.
Pro Tip: If you only remember one rule, remember this: market cap tells you size, P/S tells you how expensive that size is relative to sales, and enterprise value tells you what you’re actually paying once debt and cash are factored in.
Worked Examples: Doing the Math Yourself
Numbers make this stick faster than definitions do. Run through a few scenarios and the logic clicks.
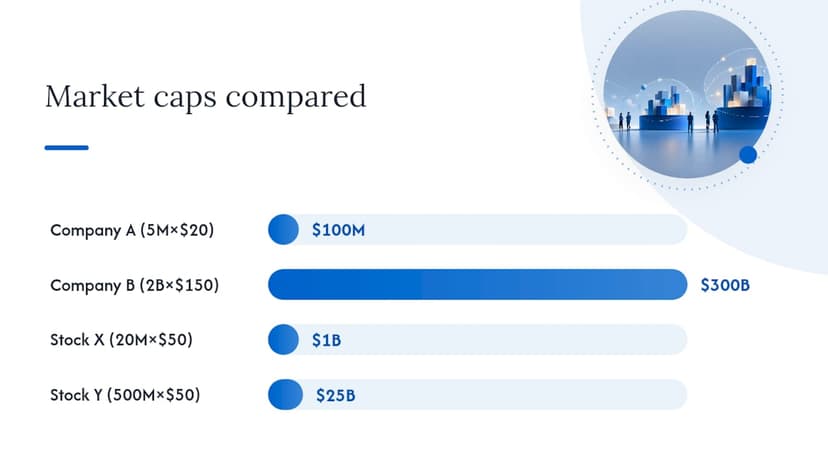
A small manufacturer trades at $20 a share with 5 million shares outstanding. Market cap: 5,000,000 × $20 = $100 million, squarely in micro-cap territory.
Scale that up. A company trading at $150 a share with 2 billion shares outstanding has a market cap of 2,000,000,000 × $150 = $300 billion, comfortably mega-cap. Same math, wildly different outcome, because share count did the heavy lifting.
- Company A: $20/share × 5 million shares = $100 million (micro-cap)
- Company B: $150/share × 2 billion shares = $300 billion (mega-cap)
Now the trap. Stock X and Stock Y both trade at $50 a share. Stock X has 20 million shares outstanding, giving it a $1 billion market cap. Stock Y has 500 million shares outstanding, putting it at $25 billion. Identical price, wildly different company size. Anyone judging a stock by price alone would miss that gap entirely, which is exactly why market cap exists as a metric in the first place.
Where to Find Reliable Market-Cap Data
Accuracy starts with the shares-outstanding number, and that number has an official home. SEC EDGAR publishes every public company’s filed share count directly from quarterly and annual reports, making it the most trustworthy source when you need to verify a figure you’ve seen elsewhere.
- SEC EDGAR: official, filed share counts straight from company disclosures.
- Exchange or broker quotes: live, real-time share prices for the multiplication.
- Aggregators: convenience and speed, combining both numbers into one instant figure.
Aggregators like MarketCapLens exist precisely to close that gap between two separate sources, pulling live pricing and share counts together across more than 2,500 companies with updates multiple times a day. That speed is valuable for quick comparisons, but if you’re making a serious investment decision, it’s still worth cross-checking the share count against the company’s most recent SEC filing, since aggregator data can lag a corporate action by a few days.
MarketCapLens’s Take: Using Market Cap Without Getting Fooled by It
We track over 2,500 companies with sector breakdowns updated multiple times daily, and the biggest mistake we see investors make isn’t miscalculating market cap. It’s trusting a single number to do too much work.
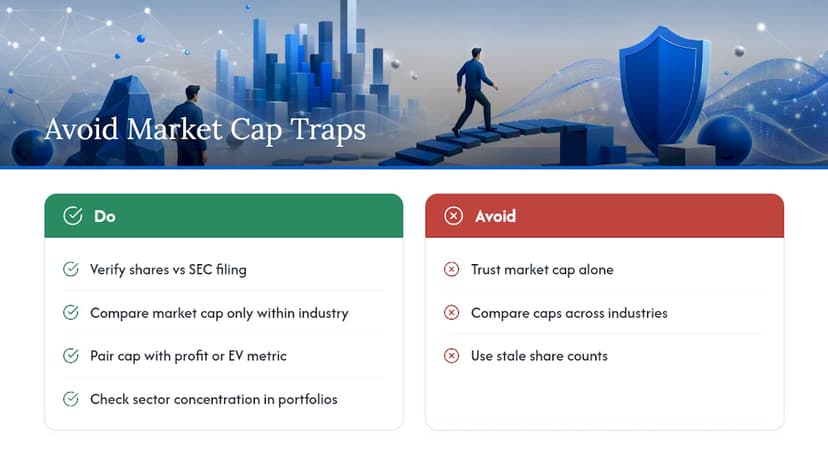
Three rules keep you honest. First, verify the shares-outstanding figure against an SEC filing if the decision matters, since a stale share count skews everything downstream. Second, only compare market cap within the same industry. A $50 billion market cap means something entirely different for a bank than it does for a software company, because capital structures and margins diverge so sharply across sectors. Third, always pair market cap with a profitability or enterprise-value metric before drawing a conclusion.
Sector breakdowns make the limitation obvious fast. Two portfolios can both claim “large-cap exposure,” but if one is quietly concentrated in a single sector because a few mega-caps dominate that group’s total cap, the actual risk profile looks nothing alike.
— MarketCapLens
See Live Market Caps and Rankings Right Now
Reading about market cap only gets you so far. At some point you want to see the actual numbers, ranked, updated, and broken down by sector instead of estimated from a stale quarterly report.

Marketcaplens tracks real-time prices and market caps across more than 2,500 public companies, refreshed multiple times a day, so the numbers you’re screening against reflect today’s market instead of last month’s snapshot. You can browse top companies by market cap, drill into sector-specific rankings like the largest industrials companies, or pull up a single name like Apple’s live market cap and price history to see exactly how the formula plays out on a real stock. Start with the rankings page and filter by sector to see where the concentration actually sits in any group you’re considering.
Sources
This article is general information, not a substitute for advice from a qualified financial advisor. Consult a qualified financial professional about your own circumstances before acting on anything here.
Recommended
For informational purposes only and is not investment advice. Do not rely on the facts, figures, ticker symbols, or other statements in this article — they may be incomplete, outdated, or incorrect, and we are not responsible for errors. See our disclaimer.