Market Cap Trends: How to Read Them and Where to Track Them
By MarketCapLens · Published · 11 min read

Market cap trends show how the total stock market value of a company, a size tier, a sector or the whole market changes over time. Market cap is share price times shares outstanding, so a trend is really the story of prices moving and share counts changing. Read it by size tier, by sector and over a long window, and it tells you where investors are putting their money. Read it as a single number on a single day and it mostly tells you about noise.
This guide explains what drives those trends, how large-, mid- and small-cap companies behave differently, how sectors diverge, and which sources let you track the data without fooling yourself.
MarketcaplensTrack Market Cap Trends in One PlaceMarketCapLens brings together frequently updated company rankings, share prices, historical data, and sector breakdowns to help you explore market trends.Explore market cap dataTL;DR
- Market cap is the current price of one share multiplied by shares outstanding, so it rises and falls with price and with issuance or buybacks.
- Long-run research finds that stock market value relative to the economy has expanded sharply in recent decades, driven largely by a shift of profits toward listed firms.
- Size tiers and sectors can move very differently in the same year: annual sector changes in one U.S. dataset ranged from roughly -37% to +63%.
- Market cap says what investors are paying, not what a business is worth. Pair it with enterprise value and other measures.
- For reliable tracking, use a live ranking for the present and official historical series for the long view.
Table of Contents
- What a market cap trend actually measures
- What makes market caps rise and fall
- The long view: market cap has outgrown the economy
- Trends by size: mega, large, mid, small and micro
- Trends by sector: the spread is wide
- What market cap trends do not tell you
- Perspective: how we read market cap trends
- How to track market cap trends reliably
- Put the data to work
- FAQ
- Sources
What a market cap trend actually measures
The definition is simple. Investor.gov defines market capitalization as the value of a corporation, found by multiplying the current public market price of one share by the total number of outstanding shares. If you want to run the arithmetic on any ticker, our market cap calculator does it from price and share count. For a fuller walk-through, see our plain-English guide to market capitalization.
A “trend” can mean four different things, and mixing them up is the most common mistake:
- A single company’s trend. One firm’s market cap over weeks, months or years.
- A ranking trend. Who sits in the top 10 or top 100, and how that list reshuffles.
- A tier or sector trend. Whether mega caps, small caps or a given industry are gaining or losing value relative to others.
- A whole-market trend. Total listed equity value, often compared with GDP.
Each answers a different question. A company can lose value while its sector gains, and a sector can rise while the market overall falls. Decide which of the four you are looking at before you read a chart.
What makes market caps rise and fall
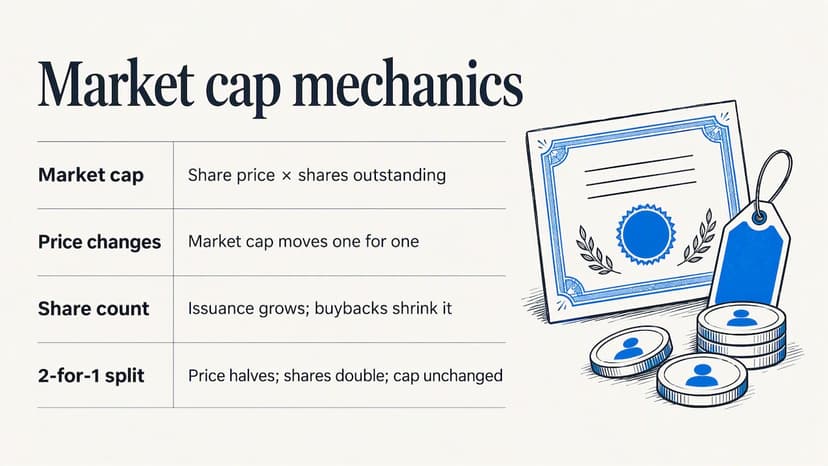
Two levers move a company’s market cap. Investopedia explains that the figure changes when the share price changes or when the company issues or repurchases shares. Exercised warrants can also add to shares outstanding.
The price lever dominates day to day. Earnings surprises, interest rate expectations, guidance, and shifts in sentiment all push the share price, and market cap follows one for one. The share-count lever works slowly: buybacks shrink the count, new issuance or option exercises grow it.
There is one event that looks like a change but is not. Per the same Investopedia page, a stock split does not change total market capitalization, because the larger number of shares is offset by a proportionally lower price per share. If a ticker’s price halves after a 2-for-1 split, its market cap has not been cut in half. This is why trends should be read in market cap, not in share price, when you compare companies or periods.
We break the mechanics down further in what makes a company’s market cap go up or down.
The long view: market cap has outgrown the economy
Over the very long run, stock market value tracked the size of the economy. A CEPR discussion paper, The Big Bang: Stock Market Capitalization in the Long Run, reports that in advanced economies market capitalization grew in line with GDP from 1870 to 1990. In recent decades, the ratio of market cap to GDP tripled and has stayed persistently high.
The same study points to a structural reason rather than a pure valuation story: a shift of profits toward listed firms. Their share of both GDP and capital income roughly doubled over 146 years. In plain terms, more of the economy’s profit now flows through public companies, so the market cap total is larger relative to output.
What this means for you:
- A high market-cap-to-GDP ratio is not, on its own, proof of a bubble. Part of it reflects a lasting change in where profits are earned.
- Comparing today’s totals with 1990 levels without that context will mislead you.
- Long series are for framing. They do not time markets.
For U.S. history you can chart yourself, the St. Louis Fed’s FRED data series on U.S. stock market capitalization include market cap relative to GDP and the share of total market cap held outside the 10 largest companies. That second series is a direct measure of concentration, one of the biggest market cap trend questions of the last decade. Note that the listed series cover specific historical windows, so check each series’ date range before you chart it.
Trends by size: mega, large, mid, small and micro
Size tiers are how most investors slice the market. FINRA’s market cap categories are:
| Tier | Market cap range |
|---|---|
| Mega cap | $200 billion or more |
| Large cap | $10 billion to $200 billion |
| Mid cap | $2 billion to $10 billion |
| Small cap | $250 million to $2 billion |
| Micro cap | Less than $250 million |
These cutoffs are conventions. Index providers and brokers draw the lines in slightly different places, so a company can be “large” in one screen and “mid” in another. Our size tier explainer shows how the bands are used in practice.
Why tiers behave differently
Smaller companies usually have less diversified revenue, thinner analyst coverage and less access to cheap financing. That makes their prices more sensitive to the economic cycle and to news. Our piece on market cap volatility and company size looks at how size shapes price swings.
Schwab’s investor education makes a related point about the cycle: smaller-cap stocks often move first coming out of a recession, while larger caps tend to do better late in a bull market. Treat that as a tendency, not a rule. Every cycle has its own leaders.
Companies move between tiers
A tier trend is partly a migration trend. A mid cap that doubles becomes a large cap. A mega cap that falls under $200 billion drops out of the category. When you compare tier performance over years, remember that the companies inside each tier at the end are not the ones that were there at the start. Winners graduate upward, which can flatter the smaller tiers’ record in some data and hurt it in others depending on how an index is rebuilt.
Earlier stages of the same size story play out in private markets, where venture capital funding trends show how capital is being concentrated into the largest rounds before companies ever list.
If you are deciding how to split money between mid and small caps, our guide to choosing between small and mid caps walks through the steps, and size factor investing covers what to check before buying small caps. The top of the market has its own page: mega cap stocks and the $200B threshold.
Trends by sector: the spread is wide
Sector moves can dwarf the market’s move. NYU Stern’s market capitalization data by U.S. industry, updated in January 2026, shows annual market cap changes through 2025 ranging from -37.41% in Chemical (Basic) to 62.72% in Coal & Related Energy. That is a spread of about 100 percentage points between industries in a single year.
Three practical lessons follow:
- An index average hides the story. A flat market can contain big winners and losers underneath.
- Sector trends are partly cyclical. Commodity-linked and rate-sensitive groups swing more than staples.
- Look at weights, not just returns. A sector’s share of total market cap shows how much it matters to the index you own.
To see which companies sit where, browse our sector rankings, and read what a sector is and how industry groups are built if the classification itself is unclear. For the current mega-cap leaders and themes, the featured page on the Magnificent 7, AI and memory stocks tracks them in one place, and you can compare individual names such as Meta Platforms.
What market cap trends do not tell you
Market cap is a measure of size and expectation. It is not a verdict on quality.
FINRA cautions that market cap reflects perceived value, which can include expectations of future growth that never materialize, and that it should not be an investor’s only metric. Investopedia adds that the share price behind it reflects what investors are willing to pay, not necessarily intrinsic value.
There are also structural blind spots:
- Debt is invisible. Market cap covers the equity part of the capital structure only. Two companies with the same market cap can carry very different debt loads. Enterprise value fixes this, and we explain the difference in market cap vs. enterprise value.
- Industry-specific measures matter. In some sectors, such as insurance, analysts use their own metrics, such as embedded value, alongside market cap.
- Rankings flatter the biggest. A top-10 list tells you who is largest today, not who will be next year.
If you want to test whether a price is justified by cash flows, our DCF calculator estimates intrinsic value per share, which you can set beside the market’s number.
Perspective: how we read market cap trends
We track more than 2,500 listed companies, and the pattern we see most often is that readers look at the wrong level. They check one company’s daily move, or a headline about the world’s largest firm, and conclude something about “the market.” The useful signals sit one level up or down.
Our approach is built on three habits. First, read rankings and sectors together: a company climbing the list matters more when you can see whether its whole sector is climbing with it. Second, separate price moves from share-count moves, since splits and buybacks change the story without changing value. Third, always pair a size number with a second lens, such as enterprise value, before drawing a conclusion.
We also think the long-run research matters more than most commentary admits. If listed firms now earn a larger share of the economy’s profit, then high totals are not automatically a warning. They are a reason to look closely at concentration, valuation and sector mix instead.
— MarketCapLens
How to track market cap trends reliably
A workable routine takes ten minutes and uses two kinds of sources.
- Start with the live ranking. Our market cap rankings show the largest public companies, with prices and sector breakdowns refreshed multiple times a day. Use it to see who is where right now.
- Check the tier. Place the company in a size band using the table above, then ask whether its tier is leading or lagging.
- Check the sector. Compare the company with sector peers, not with the index.
- Zoom out with official history. Use FRED for long U.S. series on market cap relative to GDP and concentration outside the top 10.
- Add a second metric. Look at enterprise value or valuation ratios before you act.
- Mind the date. Always note when a figure was published. Rankings change quickly, and a chart from last year is a history lesson, not a current reading.
For a yearly overview of the leaders, see our top companies by market cap investor rankings. To compare the U.S. with the rest of the world, read US vs. global market cap.
Put the data to work
If you track market cap trends regularly, our platform is built for it: live rankings of the largest public companies, sector breakdowns, daily and historical performance, and plain-English explainers, covering more than 2,500 companies and refreshed several times a day.
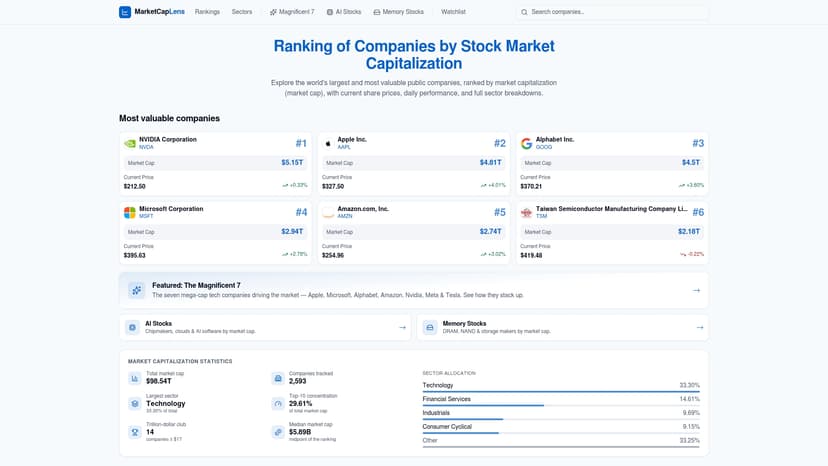
Start with the market cap rankings, then use the stock calculators for size, value and returns to test what you find.
FAQ
What is a market cap trend?
It is the change in market capitalization over time for a company, a size tier, a sector or the whole market. Market cap is the share price multiplied by shares outstanding, so a trend reflects price moves and changes in share count. Always say which level you mean, because each tells a different story.
Does a stock split change market cap?
No. A split raises the number of shares and lowers the price per share proportionally, so total market capitalization stays the same. If you see a price drop after a split, check market cap before concluding the company lost value.
Is a rising market cap always a good sign?
Not necessarily. Market cap shows what investors are willing to pay, and that can include growth expectations that do not pan out. It also ignores debt. Use it alongside enterprise value and valuation measures rather than as your only metric.
Where can I find historical U.S. market cap data?
FRED, from the St. Louis Fed, publishes historical U.S. series for stock market capitalization relative to GDP and for market cap outside the 10 largest companies. For current rankings and sector views, use a live tracker such as our market cap rankings, and check the date range of any series before charting it.
Sources
- Market Capitalization, Investor.gov
- Market Cap Explained, FINRA
- Market Capitalization: What It Means for Investors, Investopedia
- The Big Bang: Stock Market Capitalization in the Long Run, CEPR
- Market capitalization by U.S. industry, NYU Stern
- U.S. stock market capitalization series, FRED
- Venture capital trends
Recommended
For informational purposes only and is not investment advice. Do not rely on the facts, figures, ticker symbols, or other statements in this article — they may be incomplete, outdated, or incorrect, and we are not responsible for errors. See our disclaimer.