P/E vs. PEG: How the Two Valuation Ratios Differ
By MarketCapLens · Published · 11 min read
The P/E ratio tells you how many dollars you pay for each dollar of a company’s earnings. The PEG ratio takes that same P/E and divides it by the expected earnings growth rate, so it asks a second question: is the price reasonable given how fast profits are supposed to grow? P/E is a snapshot of price. PEG is P/E with growth added. Neither one is a verdict on its own, and the best use of both is side by side.
MarketcaplensCompare Companies Beyond Valuation RatiosExplore market capitalization, share prices, historical data, and sector breakdowns for thousands of public companies.Explore company dataTL;DR
- P/E = share price ÷ earnings per share (EPS). It ignores growth entirely.
- PEG = P/E ÷ expected annual EPS growth rate. It lets you compare a fast grower and a slow grower on a more even footing.
- A PEG under 1.0 is commonly read as possibly undervalued and above 2.0 as possibly expensive, but the result is only as good as the growth forecast behind it.
- PEG breaks down with negative earnings, volatile growth, or a single optimistic analyst estimate.
- Use P/E to see what the market charges today and PEG to test whether growth justifies that charge.
Table of Contents
- P/E vs. PEG at a glance
- What the P/E ratio tells you
- What the PEG ratio adds
- How to read a PEG number
- When P/E is the better tool, and when PEG is
- Limits to know before you rely on PEG
- A practical way to use both
- Perspective
- Put the ratios to work
- FAQ
- Sources
P/E vs. PEG at a glance
| P/E ratio | PEG ratio | |
|---|---|---|
| What it measures | Price paid per dollar of earnings | Price paid per dollar of earnings, relative to expected growth |
| Formula | Share price ÷ EPS | P/E ÷ expected annual EPS growth rate |
| Looks at growth? | No | Yes, through a forecast |
| Inputs | Price and one EPS figure | Price, EPS, and a growth estimate |
| Main weakness | A high or low number says nothing about growth | Sensitive to the growth forecast chosen |
| Best for | Quick screening, comparing similar mature companies | Comparing companies growing at different speeds |
One source of confusion is worth clearing up now. “PEG” is also a stock ticker. Public Service Enterprise Group trades under it, and you can see its profile on our Public Service Enterprise Group (PEG) market cap and stock price page. That is a utility company, not the ratio this article covers.
What the P/E ratio tells you
The price-to-earnings ratio divides a stock’s price per share by its earnings per share. If a stock trades at $100 and the company earned $5 per share, the P/E is 20. You are paying $20 for every $1 of annual profit.
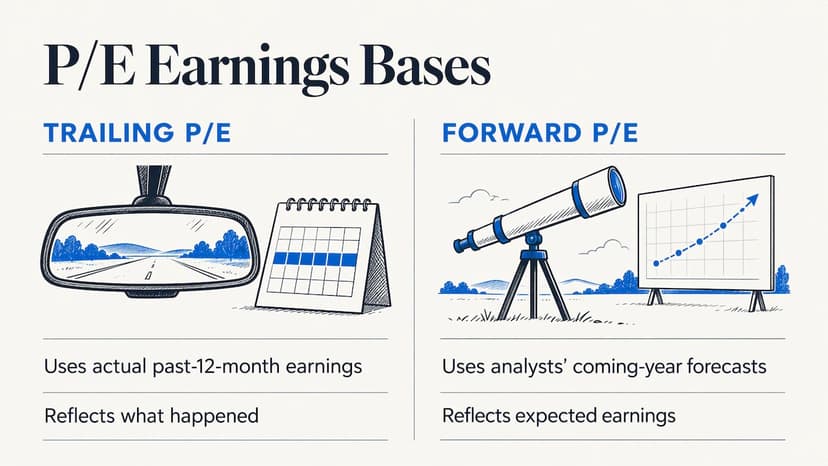
The number comes in two common flavors. According to Investopedia, trailing P/E uses actual earnings from the past 12 months, while forward P/E uses analysts’ earnings forecasts for the coming year. Trailing is based on what happened. Forward is based on what someone expects to happen. Many quote pages show only one of them without labeling it, which is why two sites can show different P/Es for the same stock on the same day.
We cover the basics, including how to read a P/E in context, in our plain-English guide to what a P/E ratio is.
Where P/E falls short
P/E is quick, which is why it is everywhere. It also leaves things out. Investopedia notes that the ratio ignores growth prospects, overlooks debt levels, and relies on accounting earnings rather than cash flow, which makes it open to accounting choices.
The growth gap is the one PEG was built to address. Picture two companies, both with a P/E of 30:
- Company A is expected to grow earnings about 30% a year.
- Company B is expected to grow earnings about 5% a year.
The P/E is identical, yet the two stocks are priced very differently relative to what each business is expected to deliver. P/E alone cannot show you that.
What the PEG ratio adds
The PEG ratio is the P/E ratio divided by the expected earnings growth rate over a stated period. Investopedia’s PEG explainer lays it out as price divided by EPS, then divided by EPS growth. Damodaran’s PEG ratios note from NYU Stern gives the same definition: PE divided by expected growth rate in earnings per share.
The growth rate goes into the formula as a whole number, so 12% growth is entered as 12, not 0.12. Investopedia’s guide to P/E and PEG describes it as P/E divided by the annual EPS growth rate.
The formula in three steps
- Find the P/E. Divide the share price by EPS. Decide whether you are using trailing or forward EPS, and stay consistent.
- Pick an expected growth rate. This is the annual EPS growth you expect, usually a multi-year analyst estimate or a growth rate you compute yourself.
- Divide. PEG = P/E ÷ growth rate (as a whole number).
A simple hypothetical example
Suppose two stocks both trade at a P/E of 24.
- Stock X has an expected EPS growth rate of 24% a year. PEG = 24 ÷ 24 = 1.0.
- Stock Y has an expected EPS growth rate of 8% a year. PEG = 24 ÷ 8 = 3.0.
These numbers are made up to show the arithmetic. On P/E alone the stocks look the same. On PEG, Stock Y is paying a much higher price for each point of expected growth. Whether Stock X is actually the better buy depends on whether its growth forecast is realistic, which is the real work.
A real-company example
CNBC walked through a calculation for Nvidia in a piece on calculating your own P/E and PEG. It used year-zero EPS of $12.96 and year-five EPS of $44.89, which implies a five-year compound annual growth rate of 28.21%. With the stock at 41 times earnings, the PEG came out near 1.45 (41 ÷ 28.21).
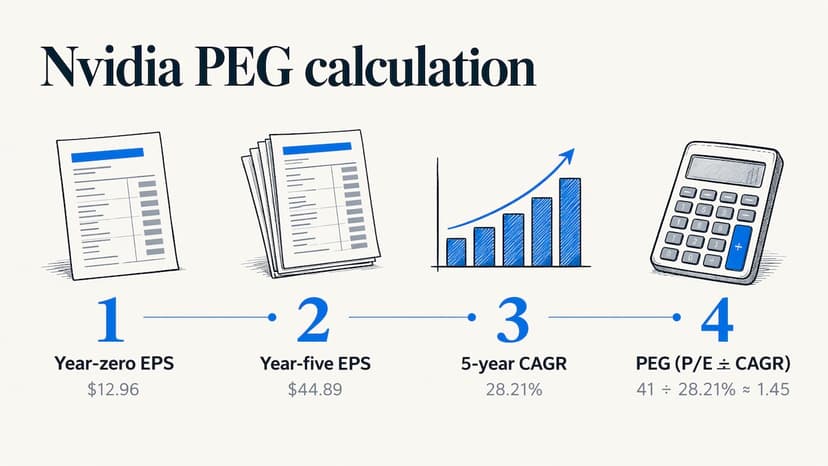
The method is worth copying: when you do not trust a published growth estimate, you can build one from a start and end EPS. CNBC gives the formula as the future EPS estimate divided by current EPS, raised to the power of 1 over the number of years, minus 1. If compounding is new to you, our article on CAGR vs. IRR explains how that growth rate works and when it fits.
You can skip the arithmetic with our P/E and PEG calculator, which takes a price, EPS and growth rate and returns both ratios.
How to read a PEG number
The common rules of thumb are simple:
| PEG | Common reading |
|---|---|
| Below 1.0 | Stock may be undervalued relative to expected growth |
| Around 1.0 | Often seen as fair value |
| Above 2.0 | Stock may be overvalued relative to expected growth |
Investopedia puts the lines at below 1.0 for possibly undervalued and above 2.0 for possibly overvalued. AAII says a PEG of 1.00 often indicates fair value, with readings below that suggesting undervaluation and readings above it suggesting the stock is priced high relative to growth potential. Forbes likewise says a PEG below 1 suggests undervaluation, and CNBC’s walkthrough treats a PEG of 1 or less as good value for future growth and 2 or more as possibly paying more than you should.
So, is a high PEG good? Usually it is read as a caution: you are paying a lot for each point of expected growth. A high PEG is not automatically a bad stock. It is a prompt to ask whether the growth forecast is too low, or whether the market is paying for qualities that earnings growth does not capture.
Treat these thresholds as starting points for questions, not buy and sell signals.
When P/E is the better tool, and when PEG is
The two ratios answer different questions, so the right choice depends on what you are comparing.
Reach for P/E when
- You are comparing companies in the same sector with similar growth and risk, such as two large banks or two grocery distributors.
- You want a fast screen across hundreds of names before doing deeper work.
- The company’s earnings are stable and growth is modest, so there is little growth difference for PEG to adjust.
- You need a number that does not depend on anyone’s forecast. Trailing P/E uses reported earnings only.
Reach for PEG when
- You are comparing companies growing at clearly different speeds, such as a software company against a utility.
- A high P/E looks alarming and you want to test whether growth plausibly supports it.
- You are screening growth-oriented stocks and want a single number that blends price and growth.
Our sector rankings help here. P/E and PEG both make most sense inside a sector, because typical valuations and growth rates differ so much between, say, technology and utilities. If you are unsure how sectors are grouped, what is a sector explains it.
Limits to know before you rely on PEG
PEG looks neat because it folds two ideas into one number. That neatness can hide problems. These are the ones that matter most.
The growth input is a forecast
AAII points out that PEG ratios are often based on just a single forecast, and that one optimistic or pessimistic analyst estimate can move the ratio materially. Two data sites can show different PEGs for the same stock because they use different growth estimates. Before trusting a PEG, find out which growth figure sits behind it, and over what period.
Inputs must match
Damodaran’s note stresses consistency. The earnings used in the P/E and the growth rate should share the same base year and period and come from the same source. It also warns about double counting, for example using forward EPS in the P/E when the growth estimate already includes the current year. A mismatch can make a stock look cheaper or more expensive than it is.
Growth and value are not linear
The same Damodaran note explains that comparing PEG across companies carries assumptions about risk and payout, because the relationship between growth and value is not a straight line. A company growing at 20% with high risk is not simply worth twice a company growing at 10% with low risk. PEG does not neutralize growth, it just puts it next to price.
Negative or erratic earnings
PEG needs positive earnings and a sensible positive growth rate. If earnings are negative, or the projected growth is negative or swings wildly from year to year, the result is not meaningful. The growth rate you plug in should also be one the company can sustain. A rate that only holds for one or two strong years will flatter the PEG.
Everything P/E misses still applies
PEG is built on P/E, so it inherits P/E’s blind spots: debt levels and the gap between accounting earnings and cash flow. A low PEG on a heavily indebted company does not carry the same message as a low PEG on one with a clean balance sheet.
A practical way to use both
Here is a workflow that uses each ratio for what it does best.
- Start with P/E. Pull the trailing and forward P/E and note the gap. A forward P/E far below trailing implies the market expects earnings to jump.
- Check the peer group. Compare against companies in the same sector. A P/E of 28 means different things in software and in food distribution.
- Compute PEG with a growth rate you understand. Use a multi-year estimate, or build your own CAGR from past and projected EPS as in the Nvidia example above.
- Test the sensitivity. Rerun the PEG with a growth rate a few points lower and higher. If the conclusion flips, your result rests on the forecast, not on the stock.
- Look beyond earnings. Cross-check with other lenses such as price-to-sales, which we explain in our market cap vs. revenue guide, and price-to-book, covered in market cap vs. book value.
Step 4 is the one most people skip, and it is the one that stops a tidy-looking PEG from giving false comfort.
Perspective
We built MarketCapLens around the idea that a valuation ratio is only useful when you can see what sits underneath it. A P/E is a price divided by earnings. A PEG is that P/E divided by someone’s growth estimate. Each piece is a number you can inspect, and the more clearly you can see the pieces, the better your judgment will be.
That is why we pair ratio education with data on more than 2,500 companies, refreshed multiple times a day, and with sector breakdowns. We think the strongest PEG reading is a comparative one: a stock against its sector peers, using inputs that match. Sector context turns a lone number into a real comparison.
Our approach is to keep the math simple and the inputs visible. That is the reason our calculators show price, earnings and growth side by side, so you can change one assumption and watch the conclusion move. Used that way, P/E and PEG are not rivals. They are two questions that belong together.
MarketCapLens
Put the ratios to work
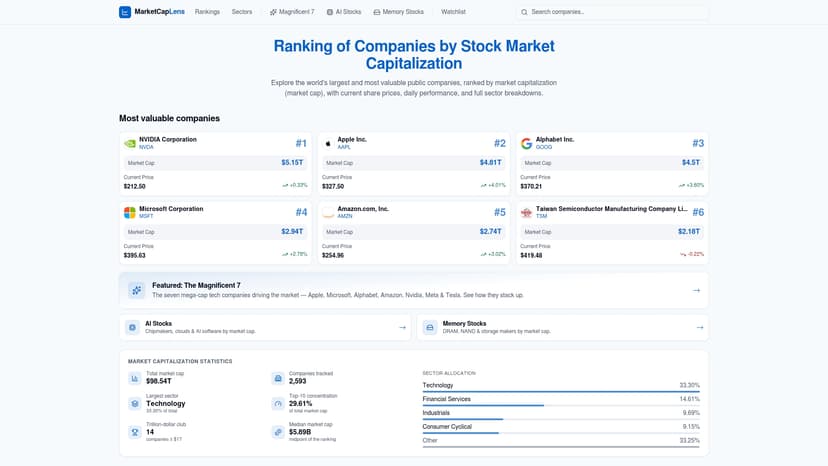
If you want to try the numbers on a stock you follow, start with our P/E and PEG calculator and adjust the growth rate to see how sensitive the result is. To find peers to compare against, browse the market cap rankings, where companies are ordered by size and grouped by sector. Our full set of stock calculators covers market cap, implied share price and returns.
Working back from a target valuation instead? The P/E valuation calculator turns an assumed P/E and EPS into an implied share price.
FAQ
Is a high PEG ratio good?
Usually not, at least on its face. A high PEG means you are paying a lot for each point of expected earnings growth, and readings above 2.0 are commonly seen as a sign a stock may be overvalued. It is worth checking whether the growth estimate behind the number is too conservative before drawing a conclusion.
What is a good PEG ratio?
A PEG of about 1.0 is often treated as fair value, and below 1.0 as possibly undervalued. These are rules of thumb. Because the ratio depends on a growth forecast, compare PEG against companies in the same sector and test it with more than one growth estimate.
Can you use PEG for companies with negative earnings?
No. PEG needs positive earnings and a positive, sustainable growth rate to mean anything. With losses, negative projected growth, or very volatile growth, use other measures such as price-to-sales instead.
Should I use trailing or forward P/E in the PEG calculation?
Either can work, but be consistent. Damodaran’s guidance is that the earnings in the P/E and the growth rate should share a base year and period and come from the same source, so you do not double count growth. Note which version your data source uses.
Is PEG the same as the stock ticker PEG?
No. The ratio is price/earnings to growth. The ticker PEG belongs to Public Service Enterprise Group, a separate topic from the valuation ratio.
Sources
- Investopedia: Price/Earnings-to-Growth (PEG) Ratio
- Investopedia: Using the P/E Ratio and PEG Ratio to Tell a Stock’s Future
- Damodaran, NYU Stern: PEG Ratios
- AAII: PEG Ratios Are Often Based on Just a Single Forecast
- CNBC: Why you should calculate your own P/E and PEG ratios
- Forbes: 10 Key Financial Ratios Every Investor Should Know
Recommended
For informational purposes only and is not investment advice. Do not rely on the facts, figures, ticker symbols, or other statements in this article — they may be incomplete, outdated, or incorrect, and we are not responsible for errors. See our disclaimer.