Blog
Over Five Years, Price vs Total Return Can Understate Investors' Gains
By MarketCapLens · Published · 9 min read

Price return measures only the change in an asset’s quoted market price. Total return adds every dividend, interest payment, and distribution, generally assuming reinvestment. For judging what you actually earned as an investor, total return is the more complete measure. Use price return only when you want to isolate pure price movement, like tracking how a stock’s ticker price behaved without the noise of income payouts.
TL;DR:
- Price return measures only the percentage change in an asset’s market price, excluding income payouts like dividends and interest.
- Total return includes dividends, interest, and distributions, providing a more accurate measure of actual investor gains, especially over long periods.
- The widely quoted S&P 500 price index omits dividend income, underestimating long-term investor returns compared to the total return series.
- Reinvested dividends compound over time, significantly widening the wealth gap between price and total return over multi-decade horizons.
- Always verify whether performance figures are gross, net, or price-only to accurately assess investment outcomes and avoid misleading comparisons.
MarketcaplensCompare Market Data With More ContextMarketCapLens brings together share prices, historic data, market trends, and sector breakdowns for research across thousands of public companies.Explore MarketCapLens
Table of Contents
- Price vs Total Return: What Price Return Actually Measures
- What Total Return Captures That Price Return Misses
- A Worked Example: Price Return vs Total Return on the Same Holding
- Choosing the Right Metric for the Job
- The Long-Term Cost of Ignoring Reinvested Distributions
- Caveats Every Investor Should Know Before Trusting a Total Return Number
- How MarketCapLens Helps You See Both Sides of the Number
- Our Take on Price vs Total Return
- Start Building Your Own Total Return Comparison
- Sources
- FAQ
Price vs Total Return: What Price Return Actually Measures
Price return is the simplest performance number in finance, and also the most misleading when used alone. It captures the percentage change in an asset’s quoted price over a period, nothing more.
The formula: (P1 − P0) ÷ P0, where P1 is the ending price and P0 is the starting price. If a stock moves from $100 to $112, price return is 12%. This calculation excludes any dividends paid along the way.
Price return has real, legitimate uses:
- Tracking pure market-price behavior — useful for technical analysis or momentum studies where dividends are irrelevant to the question.
- Reading commonly quoted index levels — many financial media headlines report price-only index levels, including the standard S&P 500 figure most people see on television.
- Comparing short holding periods — over days or weeks, dividend income barely moves the number, so price return is a reasonable shorthand.
Its limitation is straightforward: price return excludes dividends, interest, coupons, and other distributions entirely, which makes it a poor proxy for anything longer than a short trading window.
What Total Return Captures That Price Return Misses
Total return answers the question investors actually care about: how much wealth did this holding generate? It adds distributions to price change and typically assumes those distributions get reinvested rather than pocketed.
The core formula: (P1 − P0 + Income) ÷ P0. A more precise version for reinvested dividends compounds the reinvestment at each payout date rather than adding income as a lump sum at the end. CFA-style frameworks separate these components specifically so analysts can diagnose where returns actually came from.
Index providers publish more than one flavor of total return:
- Gross total return reinvests dividends without deducting any withholding tax, a cleaner but less realistic figure.
- Net total return accounts for withholding tax, giving a result closer to what many taxable investors actually receive.
- Price return stays the baseline, dividend-free series that most headlines quote.
S&P Dow Jones Indices documents all three calculations explicitly, which is why serious benchmarking always specifies which series is in play. Prefer total return whenever you’re measuring actual investor performance or comparing funds against a benchmark.
A Worked Example: Price Return vs Total Return on the Same Holding
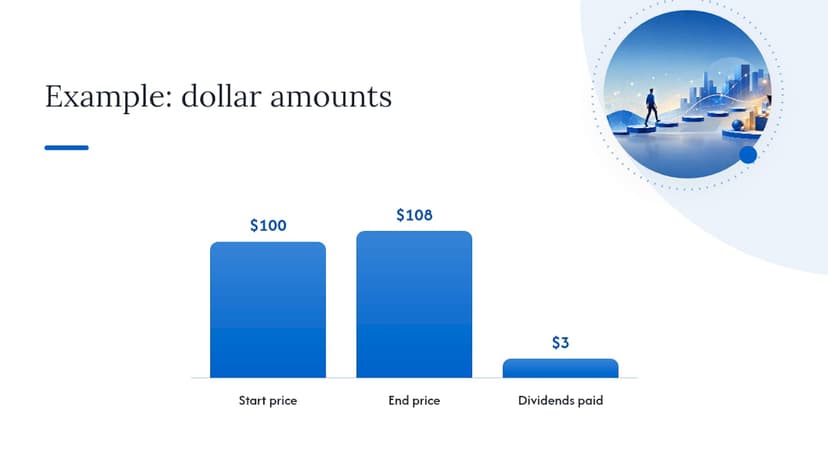
Say a stock starts the year at $100 and ends at $108, paying $3 in dividends along the way. The price return measures the 8% gain, while total return includes the dividends, resulting in a higher overall return that reflects income in addition to price change.
Scale that gap to a full index and the distortion compounds over years. This is exactly the trap with the S&P 500: the series most widely quoted in news reports, and the one FRED publishes as its default S&P 500 data, is a price index. It does not include dividends at all.
Statistic Callout: Because the widely cited S&P 500 price index strips out dividend income entirely, any multi-year comparison built on that series alone understates real investor returns. The exact size of the gap depends on the period and the dividend yield during it, but the direction is constant. Total return is always equal to or higher than price return over any period with positive distributions.
- Price-only series: what most news tickers and casual charts show.
- Gross total return: dividends reinvested, no tax deducted.
- Net total return: dividends reinvested after applicable withholding tax.
Choosing the Right Metric for the Job
Total return is the correct default for judging investor outcomes, comparing mutual funds, or benchmarking a portfolio manager, as explained in detail by What Does Risk-Adjusted Return Mean for Investors? Price return earns its place only in narrower, specific situations.
Using price return where total return belongs is a common and costly mistake, especially with income-heavy holdings:
- High-dividend stocks and REITs can show flat or negative price return while still delivering solid total return through distributions.
- Bond funds routinely show minimal price movement, since nearly all their return comes from interest income, not capital appreciation.
- Long-term comparisons of two funds with different payout policies will mislead badly if measured on price alone.
Before trusting any performance chart or comparison table, check three things: whether distributions are included, how often the series is rebalanced or reinvested, and whether the figure is gross or net of withholding tax.
Pro Tip: When two funds show identical total returns, dig into the price return component separately. One fund might be delivering that return through capital gains, the other through dividend income, and that difference matters for your tax situation even when the bottom-line number matches.
The Long-Term Cost of Ignoring Reinvested Distributions
Compounding is where the price return vs total return gap turns from a rounding error into a wealth-changing difference. Every reinvested dividend buys more shares, and those new shares generate their own future dividends. Over one year, that effect is trivial. Over three decades, it reshapes the outcome entirely.
Investor.gov’s historical illustration of long-run market performance shows exactly this: the gap between a price-only path and a dividend-reinvested path widens dramatically the longer the holding period stretches, purely from compounding reinvested income.
Statistic Callout: The mechanism is geometric, not additive. A dividend reinvested in year one keeps earning returns in years two through thirty. That’s why fund literature almost always presents “growth of $10,000” charts using total return, never price return alone.
When you’re comparing anything over five years or more, insist on a cumulative total-return chart and annualized figures rather than a raw price chart. Annualizing smooths out the noise and makes different holding periods genuinely comparable.
Caveats Every Investor Should Know Before Trusting a Total Return Number
Total return indexes are benchmarks, not account statements. Investor.gov is explicit that TRI figures are standardized comparison tools and may not equal an investor’s actual after-tax, after-fee return. Several real-world frictions sit between the published number and your brokerage statement.
- Gross total return ignores withholding tax entirely; net total return accounts for it, but your actual tax rate may still differ from either.
- Fund expense ratios, trading costs, and bid-ask spreads all subtract from what the index shows, none of which appear in a published TRI.
- Some distributions are classified as return of capital rather than income, which changes your tax treatment even though it looks identical on a total-return chart.
For a more investor-realistic figure, check a fund’s prospectus total-return table or its SEC yield rather than relying solely on an index-level TRI headline.
How MarketCapLens Helps You See Both Sides of the Number
Building your own price-versus-total-return comparison starts with reliable price data, and that’s the core of what some market data platforms track: real-time and historical prices across a large number of companies, updated multiple times daily. Pull a price series from Marketcaplens, layer in distribution data from a fund’s own reports, and you have the raw material for a genuine cumulative total-return comparison instead of a headline that only tells half the story.
Our Take on Price vs Total Return
The conventional wisdom treats price return as “the return” and total return as a footnote for dividend nerds. That’s backwards for almost every long-term investor. Price return is the footnote. It measures a slice of your outcome, not the whole thing, and treating it as the whole thing has quietly cost income-focused investors real perceived performance for decades.
Use total return to judge what you actually earned. Use price return only when you deliberately want to isolate market-price behavior. Always confirm which series, gross, net, or price-only, you’re actually looking at before you compare two numbers.
— MarketCapLens
Start Building Your Own Total Return Comparison
Most price charts you’ll find online stop at the ticker price, which is exactly the incomplete picture this article just walked through. Some market data websites provide the other half: real-time and historical price data across a wide range of public companies, refreshed multiple times daily, to help users determine whether a chart includes dividends or not.

Start on the Marketcaplens market cap rankings page to pull price history for any holding you’re evaluating, then cross-reference distribution amounts from the fund or company’s own filings to build a real total-return picture. If you want the foundational concept first, the plain-English guide to market capitalization is a solid next stop before you start comparing tickers.
Sources
- S&P US index methodology — S&P Dow Jones Indices (methodology PDF)
- S&P 500 | FRED | St. Louis Fed
- What is the S&P 500? — Business Insider
FAQ
Is the S&P 500 Price Return or Total Return?
The commonly quoted S&P 500 figure, including the series FRED publishes, is a price index that excludes dividends. S&P Dow Jones Indices separately publishes gross and net total return versions that include reinvested dividends, and the two series diverge more the longer the period you’re measuring.
What Is the 40-40-20 Rule in Investing?
There isn’t a widely recognized, standardized “40-40-20 rule” in mainstream investment methodology comparable to the price and total return formulas covered here. Definitions circulating online vary and aren’t backed by a consistent authoritative source, so treat any specific claim about it with caution.
How Much Money Do I Need to Make $10,000 a Month in Dividends?
The answer depends entirely on the dividend yield of your portfolio, which varies by holding and market conditions, so there’s no single dollar figure that applies universally. A useful approach is to calculate it yourself: divide your target annual income ($120,000) by your expected portfolio yield to estimate the principal required.
What if I Invested $10,000 in the S&P 500 20 Years Ago?
The outcome depends heavily on whether you’re measuring price return or total return, since reinvested dividends compound significantly over two decades. Investor.gov’s long-run illustration shows that dividend reinvestment meaningfully widens the gap over multi-decade periods compared to price appreciation alone, though the exact dollar result depends on the specific start and end dates chosen.
Why Does Total Return Matter More Than Price Return for Investors?
Total return matters more because it reflects your full economic outcome, including dividends and interest, not just price movement. Investor.gov notes that focusing on price alone can even mislead investors into thinking a distribution represents a loss when it’s actually a transfer of value to the shareholder.
Recommended
For informational purposes only and is not investment advice. Do not rely on the facts, figures, ticker symbols, or other statements in this article — they may be incomplete, outdated, or incorrect, and we are not responsible for errors. See our disclaimer.