QQQ vs SPY: Which ETF Fits Your Portfolio in 2026?
By MarketCapLens · Published · 10 min read
SPY gives you the broad U.S. large-cap market, 500 companies across all eleven sectors. QQQ gives you a concentrated bet on 100 Nasdaq companies. Over the past 10 and 20 years QQQ has returned more, and in the 2021-2022 rate-hike cycle it also fell further. The better choice depends on whether you want a core market holding or a growth tilt that you are ready to hold through sharp drops.
Below you will find what each fund owns, how the two have performed, what the numbers say about risk, and a simple way to decide. Every figure is dated and linked to its source.
MarketcaplensExplore the Companies Behind ETF HoldingsCompare market leaders by capitalization, track share prices, and explore historic data and sector allocations to better understand the companies shaping these indexes.VisitTL;DR
- SPY tracks the S&P 500, a diversified large-cap index spanning all 11 GICS sectors. QQQ tracks the Nasdaq-100, which holds 100 companies.
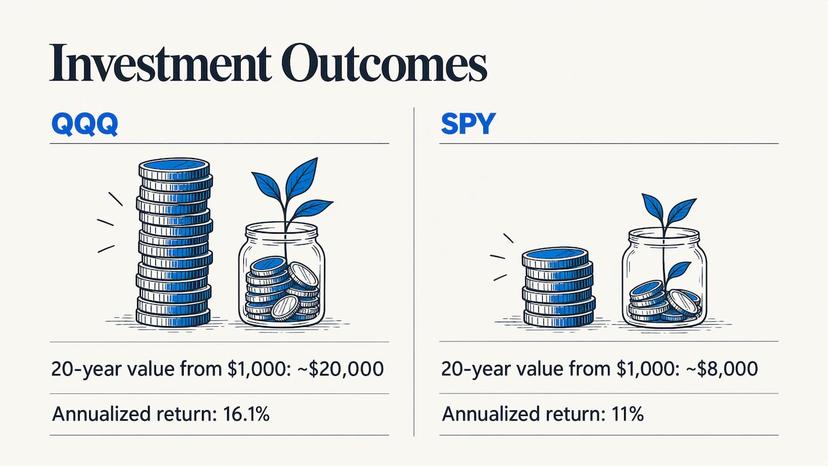
- Over 20 years, $1,000 grew to about $20,000 in QQQ (16.1% annualized) versus about $8,000 in SPY (11% annualized).
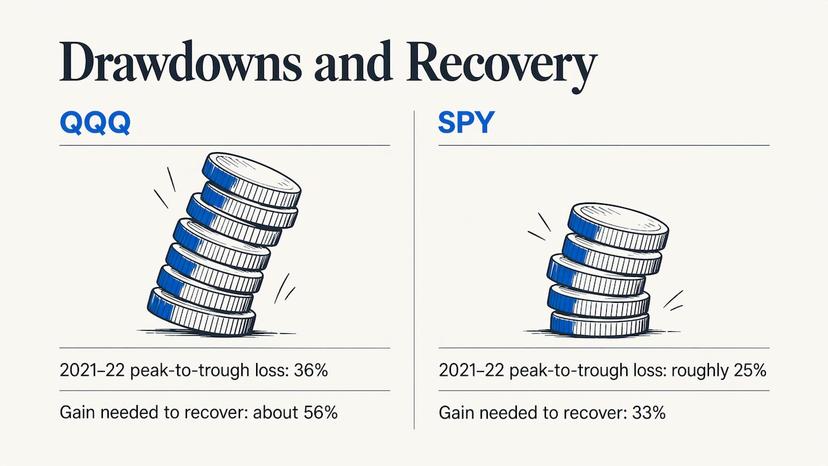
- QQQ’s edge came with deeper losses: it fell 36% from its peak in the 2021-2022 cycle, while SPY fell roughly 25%.
- Many investors use SPY as the core holding and QQQ as a growth satellite. The two overlap heavily in large technology names, so holding both is not the same as diversifying.
Table of Contents
- What QQQ and SPY actually are
- How the holdings differ
- Side-by-side comparison
- Performance: what $1,000 and $10,000 became
- The risk side: drawdowns and bad years
- Dividends, structure and trading
- How to choose: a short decision framework
- Look inside both funds with live data
- Our perspective
- FAQ
- Sources
What QQQ and SPY actually are
Both are exchange-traded funds that you buy and sell like a stock during market hours. The difference is the index each one follows.
SPY is the State Street SPDR S&P 500 ETF Trust. It tracks the S&P 500, launched in January 1993 and was the first ETF listed in the United States. State Street says it holds the same stocks as the S&P 500 in the same weightings, trades on NYSE Arca and distributes the dividend income from the stocks it holds.
Invesco QQQ is a passively managed ETF that tracks the Nasdaq-100 Index. Invesco describes it as access to 100 innovative companies in a single investment.
So the question is not really about two funds. It is about two indexes: a 500-company benchmark that stands in for the U.S. large-cap market, and a 100-company index with a much narrower focus. If you want a refresher on how the index choice shapes your exposure, the due diligence questions worth asking before you buy any fund cover documentation, fees and share classes, and they apply to both of these ETFs.
How the holdings differ
The S&P 500 is float-adjusted and market-capitalization weighted. That means the biggest companies get the biggest slices. SPY’s average holding has a market cap of roughly $1.72 trillion, which tells you how much weight the largest names carry.
Here is SPY’s sector mix as of September 30, 2026, from State Street’s fact sheet:
| Sector | SPY weight |
|---|---|
| Information Technology | 39.71% |
| Financials | 11.40% |
| Communication Services | 9.95% |
| Health Care | 9.26% |
| Consumer Discretionary | 8.60% |
| Industrials | 8.05% |
| Consumer Staples | 4.37% |
| Energy | 3.40% |
| Utilities | 1.88% |
| Real Estate | 1.70% |
| Materials | 1.70% |
Technology alone is close to 40% of SPY. That surprises many people who think of the S&P 500 as the “everything” fund. It is diversified across eleven sectors, but one sector now dominates the weighting. We track this on our own page about the S&P 500 tech sector weight, and it is worth checking live rather than trusting a number from last quarter. The related question of how much the ten largest stocks drive the index is covered in our look at S&P 500 top 10 concentration.
The practical consequence: SPY and QQQ are not opposites. A large share of the biggest companies sits in both. When you add QQQ to SPY, you are mostly increasing your weight in the same large-cap growth names, not adding a new asset class. QQQ’s 100 holdings are spread over fewer companies, so each position matters more to the result.
Side-by-side comparison
| Feature | SPY | QQQ |
|---|---|---|
| Index tracked | S&P 500 | Nasdaq-100 |
| Number of companies | About 500 | 100 |
| Sector coverage | All 11 GICS sectors | Growth and innovation focus |
| Launched | January 1993, the first U.S. ETF | Passively managed, Invesco |
| Distributions | Quarterly | Paid out from holdings |
| SPY index dividend yield | 1.10% | See Invesco’s page |
| Gross expense ratio | 0.0945% as of November 5, 2026 | See Invesco’s page |
For SPY, State Street’s product page lists an inception date of January 22, 1993, quarterly distributions, U.S.-dollar base currency, options availability and the 0.0945% gross expense ratio. Fees change, so confirm the current figure on the fund company’s page before you buy.
Both funds are large and heavily traded. QQQ holds roughly $464 billion in assets, so for most individual investors liquidity is not the deciding factor. The deciding factors are what you own and how much volatility you can live with.
Performance: what $1,000 and $10,000 became
Past returns do not predict future results, but they show what each index has rewarded and what it cost to get there.
Twenty years. Kiplinger’s 20-year comparison found that $1,000 in QQQ would be worth about $20,000 today, a 16.1% annualized total return. The same sum in SPY would be worth about $8,000, an 11% annualized return. Compounding turns a five-point annual gap into a multiple of two and a half.
Ten years. A Motley Fool analysis shows $10,000 invested in QQQ 10 years earlier would have grown to almost $66,000, a 558% total return as of July 21, 2026, compared with a 305% total return for the S&P 500. On a slightly earlier date, Invesco reports a 10-year cumulative return of 456.39% for QQQ as of June 30, 2025, which would turn $10,000 into $55,639. The figures differ because they end on different dates, which shows how much a few quarters of strong tech performance can move a long-term number.
Year by year. QQQ beat the S&P 500 in seven of the last 10 years as of June 30, 2025. That means the S&P 500 still won three of ten. A one-year snapshot can point either way, which is why short comparisons found in search results, with returns of about 27% for each fund, tell you little.
A quick worked example makes the point. Suppose you invest $500 a month for 20 years. The total contributed is $120,000 in both cases. Whether that sum ends up closer to the SPY path or the QQQ path depends on the decade you happen to live through, not only on which fund you pick. You can model your own contributions and growth assumptions with our stock calculators.
The risk side: drawdowns and bad years
Higher returns came with larger losses. QQQ lost 32.58% in 2022. Over the 2021-2022 rate-hike cycle, QQQ fell 36% from its peak while SPY fell roughly 25%.
What does a 36% drop mean in practice? On a $50,000 position, it is an $18,000 paper loss. To get back to even you then need a gain of about 56%, because the percentage you must earn is larger than the percentage you lost. A 25% drop needs a 33% gain to recover. That asymmetry is why the gap between a 25% and a 36% decline matters more than the numbers suggest.
The question for you is behavioral as much as financial. Would you hold through a drop like that, or sell near the bottom? A fund with a better long-run record only helps if you stay invested. Our guide to drawdown versus volatility explains how to measure both and which one to watch when you set your own limit.
The concentration also works as a single-theme exposure. If the sector that drives QQQ’s results stumbles, the fund has fewer other sectors to cushion the fall. SPY’s wider mix softens, though does not remove, that effect.
Dividends, structure and trading
Both funds pay out dividends from the stocks they hold, but neither is an income fund. SPY’s index dividend yield is 1.10%, and the same fact sheet cites estimated 3-5 year earnings-per-share growth of 22.21% for the index. If your goal is paying bills from distributions, neither ETF is built mainly for that. If your goal is long-term growth with dividends reinvested, both work.
On the practical side, both trade like stocks through any online brokerage, and SPY has listed options. If you prefer a lower-priced share of the Nasdaq-100 for regular small purchases, our comparison of QQQM vs QQQ covers fees, liquidity and which one to own.
One point about taxes: ETF distributions and sales are taxable events in a regular brokerage account. Talk to a tax professional about your own situation, especially if you hold either fund outside a retirement account.
How to choose: a short decision framework
- Decide the job. Do you want the fund to be your core U.S. stock holding or an add-on to a core you already own?
- Check your time horizon. The 20-year record favors QQQ, but a shorter horizon exposes you to the deep drawdowns above.
- Set a loss limit before you buy. Decide in advance the percentage drop at which you would still hold. If 36% is too much, SPY’s broader mix may fit better.
- Look at what you already own. If your 401(k) target-date fund or other holdings already lean toward large technology companies, adding QQQ increases that tilt.
- Review the current weights. Sector and top-holding weights shift every quarter. Confirm them on the fund page, not from an article that is a year old.
When each tends to fit:
- SPY fits if you want one fund that tracks the broad large-cap U.S. market, with exposure to financials, health care, industrials and the other sectors alongside technology.
- QQQ fits if you want a growth-focused exposure and accept bigger swings. Invesco’s own data places QQQ’s 15-year annualized total price return of 19.64% as of June 30, 2025 in the top 1 percentile of large-cap growth funds, and notes it can serve as a core growth holding or a satellite within a diversified strategy.
- Both fit if you size them deliberately, for example a larger SPY core with a smaller QQQ satellite. For ideas on how many funds a plan actually needs, see our sector allocation starter plans.
This is general information, not personal advice. If you are deciding how much of your savings to put in either fund, a licensed financial adviser can look at your full picture.
Look inside both funds with live data
The QQQ versus SPY debate comes down to what is inside each index right now, and that changes. MarketCapLens ranks more than 2,500 public companies by market capitalization, with share prices and sector breakdowns refreshed multiple times a day. You can see where the largest companies sit by sector on our sector rankings, check how much of the market the top names represent, and run your own return scenarios with the calculators.
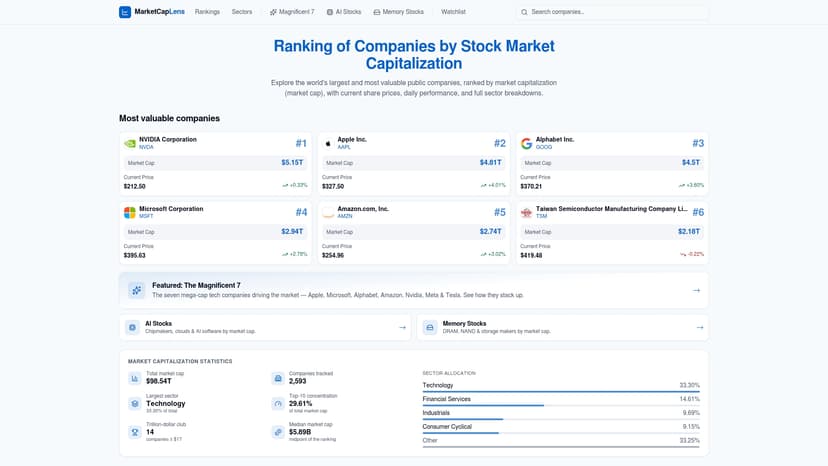
Start on the MarketCapLens homepage to explore the market-cap rankings behind both indexes.
Our perspective
When readers ask us about QQQ and SPY, the question underneath is usually about concentration: how much of my money rides on a handful of very large companies?
We built MarketCapLens around that question. Market capitalization is what decides how much of an index a company gets, so ranking more than 2,500 public companies by market cap, with sector breakdowns and daily and historical performance, lets you see the structure behind any cap-weighted fund. Our data is refreshed multiple times daily, so you are looking at the current picture rather than a snapshot from last quarter.
Our view is that the fund label matters less than what you can see inside it. Look at the sector weights, look at how large the top names have become, and decide whether that mix matches the job you want the money to do. Do that, and the choice between a broad index and a growth-focused one becomes a decision you can explain to yourself.
MarketCapLens
FAQ
Does QQQ outperform the S&P 500?
Over long periods it has. QQQ beat the S&P 500 in seven of the 10 years ending June 30, 2025, and a 10-year total return of 558% versus 305% for the S&P 500 was reported as of July 21, 2026. It has not won every year, and it fell 32.58% in 2022.
What if I invested $10,000 in QQQ 10 years ago?
As of July 21, 2026, the sum would have grown to almost $66,000, a 558% total return. On the earlier June 30, 2025 measure from Invesco, the same $10,000 would have been $55,639. Your own result depends on your start and end dates.
How has QQQ performed compared to SPY over 20 years?
A $1,000 investment in QQQ would be worth about $20,000, a 16.1% annualized total return, while the same amount in SPY would be worth about $8,000, an 11% annualized return. Past performance does not guarantee future results.
Is QQQ or SPY better for a beginner?
Many beginners start with a broad fund such as SPY because it spans all 11 GICS sectors and has a smaller historical drawdown. QQQ suits those who want a growth tilt and can tolerate larger swings. Pick based on your time horizon and how you would react to a 30% or larger drop.
Can I own both QQQ and SPY?
Yes, but the two overlap in large technology companies, so owning both raises your technology exposure rather than spreading it. A common approach is a larger core in the broad index and a smaller growth satellite.
Sources
- State Street SPDR S&P 500 ETF Trust fact sheet, September 2026
- State Street: SPY, the original S&P 500 ETF
- State Street: SPY product page
- Invesco QQQ ETF
- Invesco: Understanding QQQ’s performance through market cycles
- Kiplinger: QQQ vs SPY, what $1,000 invested 20 years ago is worth now
- The Motley Fool: If you’d invested $10,000 in QQQ 10 years ago
Recommended
For informational purposes only and is not investment advice. Do not rely on the facts, figures, ticker symbols, or other statements in this article — they may be incomplete, outdated, or incorrect, and we are not responsible for errors. See our disclaimer.