QQQ vs VGT: Nasdaq-100 or a Pure Tech ETF?
By MarketCapLens · Published · 11 min read
QQQ and VGT both give you heavy exposure to the same handful of mega-cap technology stocks, but they are built on different ideas. QQQ (Invesco QQQ Trust) owns the Nasdaq-100, about 100 of the largest nonfinancial companies listed on Nasdaq, across several industries. VGT (Vanguard Information Technology ETF) owns the whole U.S. information technology sector, 318 stocks as of September 30, 2026, from mega-caps down to small caps. Pick QQQ if you want a large-cap growth index with some non-tech names. Pick VGT if you want a pure, broader technology-sector bet at a lower fee.
This guide walks through what each fund tracks, what is actually inside, what each costs, how concentrated they are and which kind of investor each one suits. Every holding and fee figure comes from the fund issuers’ own documents, dated where they can change.
MarketcaplensSee the Companies Behind Market TrendsCompare ETF choices with a broader view of the companies shaping market capitalization, sector allocations, and daily performance.VisitTL;DR
- Index: QQQ tracks the Nasdaq-100. VGT tracks the MSCI US Investable Market Information Technology 25/50 Index.
- Sector mix: QQQ reported 68.01% technology as of September 30, 2026, with the rest in areas such as consumer discretionary and telecommunications. VGT is a technology-sector fund by design.
- Concentration: VGT’s top three holdings (NVIDIA, Apple, Microsoft) added up to 44.7% of the fund on that date. QQQ’s top three were about 21.7%.
- Cost: QQQ lists a 0.18% expense ratio. VGT lists 0.09%.
- Decision rule: QQQ is the broader growth-style choice. VGT is the cleaner, more concentrated technology-sector choice.
Table of Contents
- What each ETF actually tracks
- Side-by-side comparison
- What is inside: holdings and overlap
- Sector exposure: 68% versus all-in
- Costs: expense ratio and yield
- Performance and risk
- Worked example: what changes in a portfolio
- Which one fits which investor
- Our perspective
- See the holdings behind the ticker
- FAQ
- Sources
What each ETF actually tracks
The difference starts with the index, and an index is just a rulebook for which stocks go in and how much of each to hold.
QQQ: the Nasdaq-100
QQQ holds the component securities of the Nasdaq-100. According to an SEC filing describing the index, the Nasdaq-100 consists of 100 of the largest domestic and international nonfinancial companies listed on Nasdaq. Notice what the rule is not: it does not say “technology.” A company qualifies by where it lists and by being nonfinancial, so the sector mix is a result of which companies are large, not a mandate.
That is why Invesco’s September 30, 2026 fact sheet shows technology at 68.01%, consumer discretionary at 15.14% and telecommunications at 5.91%. If large Nasdaq-listed retailers, streaming companies or carmakers grow, they gain weight. If tech leaders grow faster, the tech share rises. The same fact sheet says the index is rebalanced quarterly and reconstituted annually, which is how those shifts get reflected.
VGT: the U.S. information technology sector
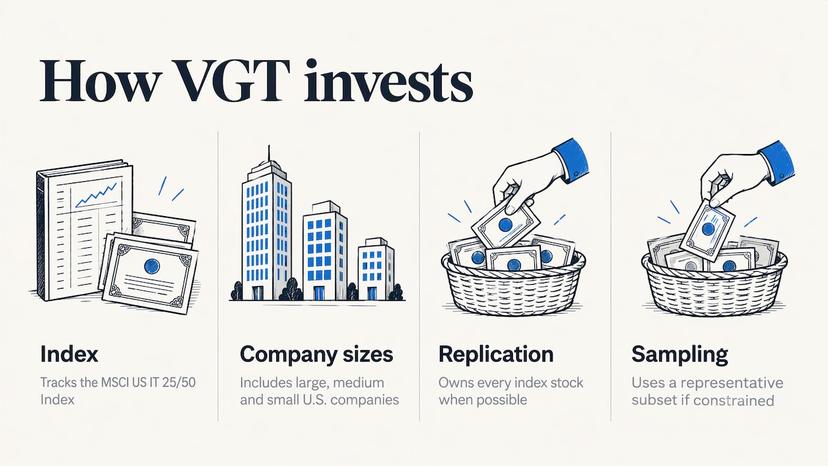
Vanguard’s September 30, 2026 fact sheet says VGT passively seeks to track the MSCI US Investable Market Information Technology 25/50 Index. It represents U.S. information technology companies across large, medium and small capitalization bands. The “25/50” label refers to a cap on concentration that keeps the index compliant with fund diversification rules, so the biggest names are not allowed to grow without limit inside the index.
The fund uses full replication when possible, meaning it owns every stock in the index in index proportions. If regulatory constraints prevent that, it falls back on sampling, which means owning a representative subset. It also stays fully invested rather than holding large cash balances.
If the word “sector” is new, our primer on what a sector is explains how industry groups are defined and how companies are ranked within them.
Side-by-side comparison
| QQQ | VGT | |
|---|---|---|
| Index | Nasdaq-100 | MSCI US Investable Market Information Technology 25/50 |
| Selection rule | Largest nonfinancial Nasdaq-listed companies | U.S. information technology sector |
| Number of holdings | About 100 companies | 318 stocks (Sept. 30, 2026) |
| Technology exposure | 68.01% (Sept. 30, 2026) | Sector-pure by design |
| Top holding | NVIDIA 8.36% | NVIDIA 17.6% |
| Expense ratio | 0.18% | 0.09% |
| Market-cap range | Large caps | Large, mid and small caps |
| Issuer | Invesco | Vanguard |
Fee data for VGT is from Vanguard’s product page, which lists a 0.09% expense ratio as of December 19, 2025. QQQ’s 0.18% is from the Invesco fact sheet above. Expense ratios are reviewed by issuers and can change, so confirm on the fund page before you buy.
What is inside: holdings and overlap
The top of each fund looks similar at first glance. The weights tell a different story.
VGT’s top ten as of September 30, 2026 (Vanguard): NVIDIA 17.6%, Apple 15.9%, Microsoft 11.2%, Micron 4.5%, Broadcom 4.1%, AMD 3.7%, Intel 2.0%, Cisco 1.6%, Lam Research 1.6% and Palantir 1.6%.
QQQ’s largest positions on the same date (Invesco): NVIDIA 8.36%, Apple 7.38%, Alphabet 5.93%, Microsoft 5.78%, Micron 5.04%, AMD 4.19%, Amazon 4.08%, Meta 3.27% and Tesla 2.83%.
Three things stand out.
- Heavy overlap at the top. NVIDIA, Apple, Microsoft, Micron and AMD appear in both lists. Owning both funds means owning the same companies twice, not two different bets.
- QQQ reaches beyond the tech sector. Alphabet, Amazon, Meta and Tesla are among QQQ’s largest positions. They do not appear in VGT’s top ten, so a QQQ investor carries exposure to advertising, online retail, social media and autos that a VGT investor does not get from those names.
- VGT is far more top-heavy. Add the first three VGT weights and you get 44.7%. Add QQQ’s first three and you get 21.67%. In VGT, three companies drive almost half the fund’s day-to-day movement.
VGT’s breadth shows up lower down the list. With 318 stocks and mid- and small-cap exposure, its tail holds many software, semiconductor and hardware companies that QQQ’s rulebook never reaches. Those positions are small, though, so they soften the concentration only slightly.
You can check any of these companies yourself. The market cap rankings show where each stands by size, and the Magnificent 7, AI and memory stock page groups many of the names that dominate both funds.
Sector exposure: 68% versus all-in
The headline difference in QQQ vs VGT is how much of each fund is technology. QQQ’s 68.01% technology weight leaves about a third of the fund elsewhere. The largest slices on the fact sheet are consumer discretionary at 15.14% and telecommunications at 5.91%.
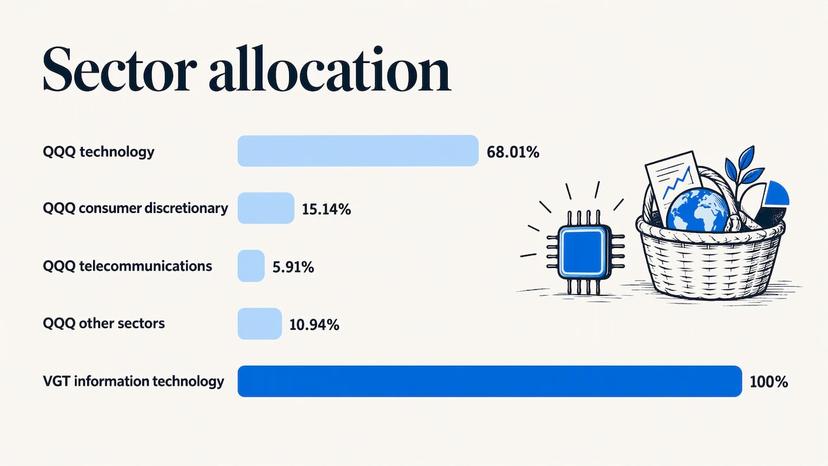
VGT is a single-sector fund. When technology stocks rally, VGT should capture all of it. When they fall, nothing in the fund cushions the drop. QQQ’s non-tech third is not a hedge, since those companies are also large growth names, but it does diversify the sources of return.
Technology also dominates broad indexes. If you already own an S&P 500 fund, you hold a large tech position before adding either ETF. Our piece on the S&P 500’s tech sector weight shows how to verify that figure live, and S&P 500 top 10 concentration covers how much a few stocks control that index.
Costs: expense ratio and yield
VGT’s 0.09% expense ratio is half of QQQ’s 0.18%. On a $10,000 holding, that is $9 a year versus $18 a year, a $9 gap before any market movement. On $100,000, the gap is $90 a year. The fee gap is real but small next to the swings in either fund’s price.
On income, QQQ’s fact sheet lists a 0.39% 30-day SEC yield. That figure is a snapshot that changes with the fund’s holdings and dividends, so treat it as a rough size, not a rate to plan around. Both funds pay little income because the companies inside them mostly reinvest profits instead of paying them out. If income matters to you, neither is an income fund.
For a closer look at QQQ’s own cost structure, including the lower-fee share class of the same index, read QQQM vs QQQ: fees, liquidity and which one to own.
Performance and risk
Vanguard’s fact sheet states that its performance figures assume reinvested distributions and are net of expenses. Use that standard when you compare: total return with distributions reinvested, same start and end dates, after fees. A chart of price alone understates both funds.
Because the two portfolios share their biggest names, their returns tend to move in the same direction most of the time. The gaps open up when the market rewards or punishes the non-tech parts of the Nasdaq-100, or when the mega-cap leaders diverge from smaller technology firms. Trailing returns shift with every month-end and depend heavily on the window, so check a current total-return chart for the period you care about instead of relying on a number in an article.
On risk, the issuer’s own wording is plain. Invesco’s fact sheet says QQQ is non-diversified and may experience greater volatility than a more diversified investment. VGT, with a single sector and a 44.7% weight in three stocks, carries the same kind of risk in a more concentrated form. Both funds can fall sharply in a technology downturn, and past results do not predict future returns.
A practical way to size that risk: decide how large a loss you could sit through, then apply it to the fund’s share of your total portfolio. A holding that is 10% of your money behaves very differently from one that is 60%.
Worked example: what changes in a portfolio
Say you have $50,000 to invest and already hold a total-market fund.
- Adding $10,000 of QQQ puts roughly 68% of that slice, about $6,800, into technology and about $3,200 into consumer, communications and other areas. About $2,170 of it sits in the top three names.
- Adding $10,000 of VGT puts all $10,000 into technology. About $4,470 of it sits in NVIDIA, Apple and Microsoft alone.
- Adding $5,000 of each gives you the overlap problem: your NVIDIA, Apple and Microsoft exposure is stacked twice, and your fees blend to about 0.135%.
The arithmetic uses the September 30, 2026 weights above, which drift every day with prices. The point is how the structure behaves, not the exact dollars.
Which one fits which investor
QQQ suits you if:
- You want large-cap growth with some exposure beyond technology, such as online retail, media and consumer brands.
- You prefer a fund of roughly 100 companies with a well-known index and rules that reshuffle it each year.
- You want the most widely referenced Nasdaq-100 product.
VGT suits you if:
- You want a pure information-technology position, including mid- and small-cap companies.
- You want the lower expense ratio and the full 318-stock breadth.
- You accept that a few stocks, led by NVIDIA, Apple and Microsoft, will drive most of the result.
Neither may suit you if you want broad market exposure as your core holding. In that case, compare the broad options first, as in QQQ vs SPY, or look at practical sector allocation plans with three to five ETFs, where a tech fund is a satellite around a diversified base.
For most investors who already hold a diversified fund, the useful question is not which of the two is better. It is how much extra technology you want on top of what you own, and whether you want it narrow (VGT) or mixed with other growth industries (QQQ).
Our perspective
We built MarketCapLens around one idea: a fund’s label tells you less than its holdings and weights. QQQ and VGT prove it. Both are called tech ETFs in casual conversation, yet one is a Nasdaq listing rule and the other a sector index, and their top holdings carry weights that differ by a factor of two.
The most useful habit we can suggest is to look through the fund to the companies. Check where each holding ranks by market capitalization, which sector it belongs to and how much of your total portfolio those companies add up to across every fund you own. When three companies make up 44.7% of one ETF and also sit near the top of another, that is the number that matters, not the ticker.
Our rankings cover more than 2,500 companies and refresh multiple times daily, and our sector pages group them by industry. That lets you see in minutes whether a fund’s story matches its portfolio, and whether adding a second fund adds a new bet or repeats the first.
MarketCapLens
See the holdings behind the ticker
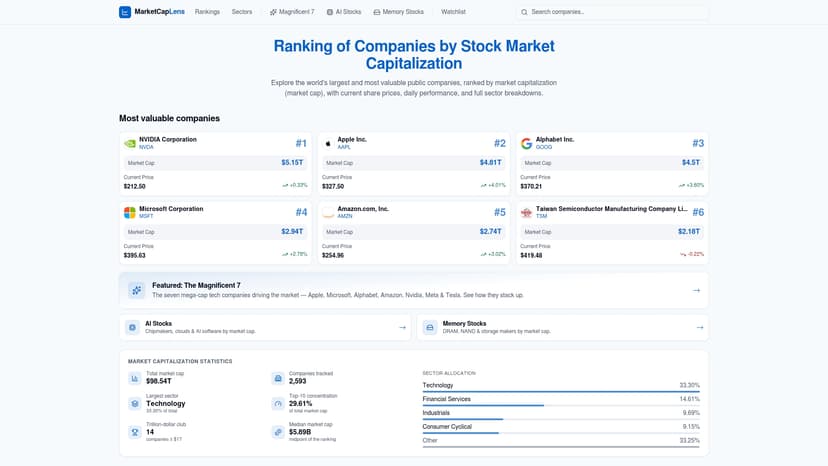
Before you choose, check the companies themselves. MarketCapLens ranks more than 2,500 public companies by market capitalization, with share prices, sector breakdowns and daily and historical performance, refreshed multiple times a day. Open the market cap rankings to see how NVIDIA, Apple and Microsoft stack up against everyone else, or browse the sector pages to see how industries compare.
If you want to work out a company’s size yourself, the market cap calculator multiplies price by shares outstanding, and the wider stock calculators cover size, value and returns.
FAQ
Is QQQ or VGT better?
Neither wins for everyone. VGT has the lower expense ratio, 0.09% against 0.18%, and holds 318 technology stocks. QQQ holds about 100 Nasdaq-listed companies, including consumer and communications names, which makes it less purely tech. Choose by the exposure you want, not by the label.
Do QQQ and VGT hold the same stocks?
Many of the largest ones, yes. As of September 30, 2026, NVIDIA, Apple, Microsoft, Micron and AMD appeared among the top positions of both funds. The weights differ: NVIDIA was 17.6% of VGT and 8.36% of QQQ. QQQ also holds companies such as Amazon, Meta and Tesla near the top, which are not in VGT’s top ten.
Should I own both QQQ and VGT?
Owning both mostly doubles your exposure to the same leading technology stocks, since their top holdings overlap heavily. It can make sense only if you deliberately want a larger technology position overall. Otherwise one of the two, sized to your total portfolio, does the job.
How does QQQ differ from QQQM?
Both follow the Nasdaq-100, so the holdings are the same. They differ in fees, share price and trading features. Our guide to QQQM vs QQQ covers which share class fits which type of owner.
Is VGT riskier than QQQ?
VGT is a single-sector fund with 44.7% in its top three stocks, so its results depend more heavily on a few technology companies. QQQ is also non-diversified, according to Invesco’s fact sheet, and can be volatile, but it spreads some weight across other industries. Match either one to a loss you can tolerate.
Sources
- Invesco QQQ Trust fact sheet, September 30, 2026
- Vanguard Information Technology ETF fact sheet, September 30, 2026
- SEC filing describing the Nasdaq-100 index
- Vanguard Information Technology ETF (VGT) product page
Recommended
For informational purposes only and is not investment advice. Do not rely on the facts, figures, ticker symbols, or other statements in this article — they may be incomplete, outdated, or incorrect, and we are not responsible for errors. See our disclaimer.