QQQM vs QQQ: Fees, Liquidity and Which One to Own
By MarketCapLens · Published · 9 min read
QQQ and QQQM both track the same index, the Nasdaq-100, so the choice comes down to cost and trading. QQQM charges a lower expense ratio (0.15% vs 0.18%) and suits buy-and-hold investors. QQQ trades far more heavily and suits people who trade in size or move in and out often. Neither is a better bet on tech stocks. They are two share classes of the same idea.
MarketcaplensExplore the Companies Behind QQQCompare market caps, share prices, historic data, and sector allocations for the public companies shaping market trends.Explore company dataTL;DR
- Both funds are run by Invesco and follow the Nasdaq-100 Index, so their holdings and returns are nearly identical.
- QQQM’s expense ratio is 0.15%, versus 0.18% for QQQ. On $10,000 that is a $3 a year gap.
- QQQ offers deeper secondary-market liquidity, which matters most for large or frequent trades and for options.
- Big gaps in “5-year return” you see online usually come from QQQM’s October 2020 launch and mismatched chart windows, not from different strategies.
- Long-term investor adding monthly: QQQM is the natural default. Active trader: QQQ.
Table of Contents
- What QQQ and QQQM have in common
- Expense ratio: the difference that compounds
- Liquidity and trading costs
- Performance: why the numbers look so different online
- Dividends and taxes
- Risks both funds share
- Which one should you choose?
- Perspective
- See what’s inside before you buy
- FAQ
- Sources
What QQQ and QQQM have in common
Invesco describes QQQ as a passively managed ETF that tracks the Nasdaq-100 Index, giving exposure to many industry-leading companies in one holding. QQQM follows the same index. Invesco itself frames the pair this way: QQQ for liquidity and cost-effective trading, QQQM for a lower expense ratio and long holding periods.
The Nasdaq-100 is a market-cap-weighted index of large non-financial companies listed on Nasdaq. Because weighting follows company size, a handful of mega-cap names drive a large share of results. That is true for both funds, and it is the main risk you take on whichever ticker you pick.
That means:
- The same top companies, in nearly the same proportions.
- The same sector tilt, heavy in technology and communication services.
- The same rebalancing schedule, because both follow the index rules.
- The same sponsor and the same underlying market risk.
Are the holdings exactly the same?
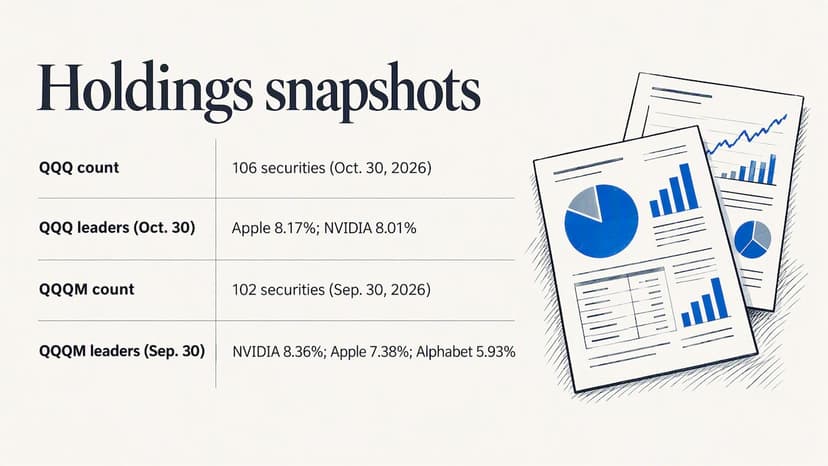
Close, but you will see small differences in snapshots. According to Invesco’s data, as of October 30, 2026, QQQ holds 106 securities, led by Apple at 8.17% and NVIDIA at 8.01% of net assets. As of September 30, 2026, QQQM held 102 securities, with NVIDIA at 8.36%, Apple at 7.38% and Alphabet at 5.93%.
Those two figures are a month apart, so they are not a clean side-by-side. The count differs because some companies have more than one share class in the index, and the dates differ. Do not read the gap as a strategy difference. If you want to compare weights precisely, pull both holdings files for the same date from Invesco’s site.
The index itself also changes. Effective May 1, 2026, Nasdaq made methodology changes, including a requirement that eligible securities have a three-month average daily traded value of at least $5 million. Both funds inherit those rules.
Expense ratio: the difference that compounds
The expense ratio is the annual fee, taken out of fund assets automatically. You never see a bill. It shows up as slightly lower returns.
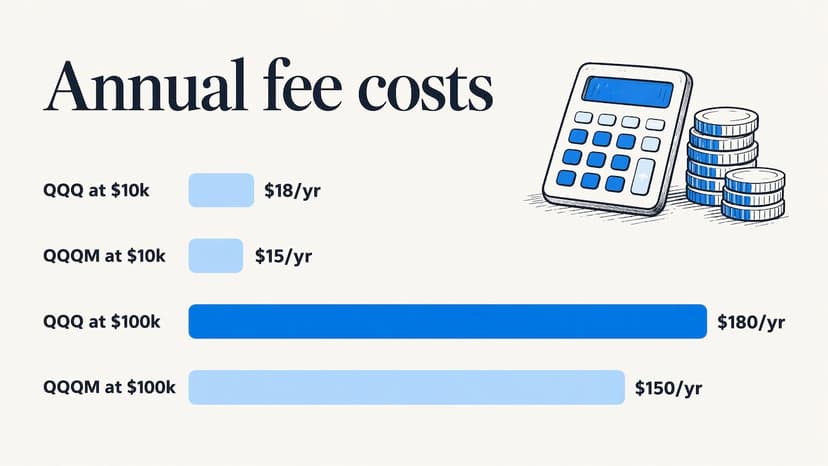
| QQQ | QQQM | |
|---|---|---|
| Expense ratio | 0.18% | 0.15% |
| Annual cost on $10,000 | $18 | $15 |
| Annual cost on $100,000 | $180 | $150 |
| Annual cost on $500,000 | $900 | $750 |
The dollar figures above are simple arithmetic on the stated ratios, before any growth. The gap is 0.03 percentage points. On a $10,000 position it is $3 a year. On $100,000 it is $30. As the balance grows over decades, the gap grows with it, since fees are charged on a larger base.
The QQQ number is itself new. Invesco reclassified QQQ from a unit investment trust to an open-end ETF structure, which cut its expense ratio from 0.20% to 0.18%. Invesco says that change did not trigger taxable events for existing shareholders, and that the new structure lets the fund reinvest income, use futures and lend securities, which brings it in line with most ETFs. Older articles quoting 0.20% for QQQ are out of date.
Is 0.03% worth caring about? It is small, but it is free money for a buy-and-hold investor, because nothing else about the fund changes for you. For a short-term trader, it is noise next to trading costs.
Liquidity and trading costs
QQQ is the older and much larger fund, and its trading volume reflects that. High volume usually means tighter bid-ask spreads, the gap between what buyers bid and sellers ask. That gap is a real cost every time you trade.
What this means in practice:
- Small, infrequent purchases. If you buy a few hundred or a few thousand dollars at a time, QQQM’s spread is typically small enough that the lower fee wins. Use limit orders and avoid the first and last minutes of the trading day, when spreads can widen.
- Large orders. Institutions and people trading six-figure blocks may prefer QQQ because of its deeper secondary market, which is exactly the use case Invesco points to for larger trade sizes and shorter holding periods.
- Options. QQQ has long been the go-to underlying for options strategies. If you plan to trade options on the Nasdaq-100, check the chain on both tickers in your brokerage before choosing.
Check the live spread on your own broker’s quote screen before you buy. A spread of one cent on a roughly $200 to $600 share is a rounding error. A spread of several cents on a large order is not.
Performance: why the numbers look so different online
A common forum question asks why QQQ appears to be up roughly 170% over five years while QQQM is up about 60%. The funds did not diverge. The explanation is almost always time frame.
QQQM began trading on October 13, 2020, while QQQ has traded since 1999. If one chart starts at QQQ’s five-year mark and another starts at QQQM’s first day, or uses a different end date, the percentages cannot be compared. A chart that shows price change only will also differ from one with dividends reinvested.
To compare them properly:
- Use the same start and end dates for both tickers.
- Use total return, with dividends reinvested, not price only.
- Use the fund’s own month-end or quarter-end standardized returns from Invesco’s site for official figures.
- Expect a gap of roughly the fee difference per year, about 0.03 percentage points, plus small tracking noise.
For the same reason, any “what if I invested $10,000 five years ago” figure depends on the exact dates. Run it yourself with matching dates in a total return calculator and you should see QQQ and QQQM land within a rounding error of each other. Our stock calculators can help with the return math once you have the start and end prices.
Past performance does not predict future results. The Nasdaq-100 has had long strong runs and also deep drawdowns, including the 2000-2002 decline and 2022. Both tickers fall with it.
Dividends and taxes
Both funds pay a small quarterly dividend, since most Nasdaq-100 companies pay little or nothing. Yields are low, in the neighborhood of 0.4% by recent third-party listings, and they differ only slightly. Lower fees leave marginally more income in QQQM, which is why its yield can look a hair higher.
For taxes, both are ordinary ETFs in a taxable account: qualified dividends are taxed at long-term rates if you meet holding rules, and you owe capital gains when you sell at a profit. Switching from one to the other in a taxable account is a sale, so it can trigger a gain. In an IRA or 401(k), there is no such issue. Talk to a tax professional about your own situation before swapping a large position with big gains.
Risks both funds share
Owning either fund means owning the Nasdaq-100’s risks. The QQQ prospectus lists market risk, index risk, equity risk and market trading risk among its principal risks. It also describes authorized participant concentration risk: only a limited number of institutions can create or redeem shares directly with the fund. In practice, this matters mostly in stressed markets, when an ETF’s price can drift from its underlying value.
The bigger practical risk is concentration. A few giant companies carry a large part of the index, so your result depends heavily on them. If you already own an S&P 500 fund, you hold many of the same names. Our guides on market concentration risk and whether the S&P 500’s top 10 have passed 40% again show how to measure the overlap with live data.
Which one should you choose?
There is no wrong answer on strategy. Choose on how you will use it.
| Your situation | Likely fit |
|---|---|
| Monthly or yearly contributions, hold for years | QQQM |
| Retirement account, set-and-forget | QQQM |
| Small to medium position, rarely trade | QQQM |
| Frequent trading or tactical entries and exits | QQQ |
| Large block trades | QQQ |
| Options strategies on the Nasdaq-100 | QQQ, after checking both chains |
| Already hold QQQ with large unrealized gains in a taxable account | Usually stay put; ask a tax professional |
One more point: you do not need both. Holding the two together gives you the same exposure twice and adds nothing in diversification.
Perspective
We look at QQQ and QQQM every day through market cap data, and what stands out is how little separates them. Both are built from the same ranking: the largest non-financial companies on Nasdaq, weighted by size. When you track the top holdings across our database of more than 2,500 companies, you see the same names moving together.
That is why we think the ticker matters less than understanding what is inside it. A fund can be cheap and liquid and still leave you heavily exposed to a few companies and one sector. Before you buy either, look at the weights, compare them with your other funds, and check how much of your portfolio sits in the top ten names.
Our approach is to make that check easy: sector breakdowns, market cap rankings and daily performance in plain English, refreshed multiple times a day. Use the fee and liquidity comparison to pick the ticker, then use live data to decide how much is the right amount.
MarketCapLens
See what’s inside before you buy
The ticker is the small decision. The big one is what you own. On MarketCapLens you can look up the biggest Nasdaq-100 names, see their market caps and recent performance, and check how sectors stack up.
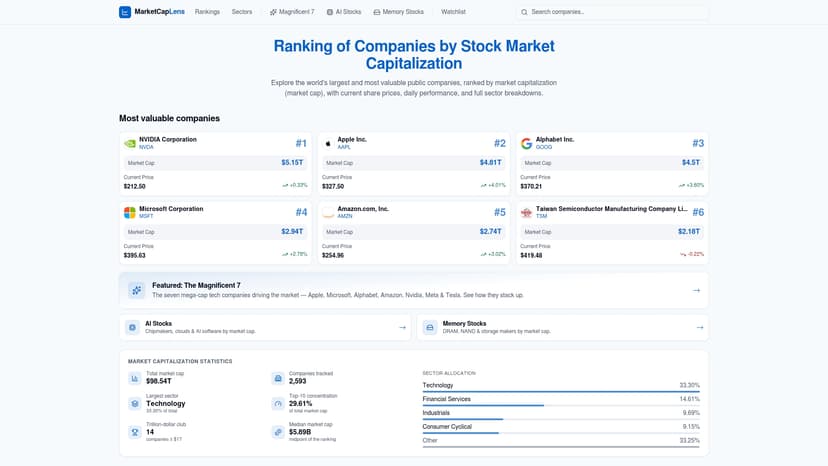
Start with our featured lists of the Magnificent 7 and AI stocks or browse companies ranked by sector. If you want a structured check of your own holdings, our five-step concentration audit walks you through it.
FAQ
Is QQQM or QQQ better to invest in?
For most long-term investors, QQQM is the better fit because it holds the same index at a lower expense ratio, 0.15% vs 0.18%. QQQ makes more sense if you trade often, place large orders or use options. Neither fund outperforms the other on strategy, since both follow the Nasdaq-100.
Is QQQM the same as QQQ?
Not legally, but economically they are very close. They are separate funds from Invesco that track the same index, with nearly identical holdings and returns. The differences are the fee, the share price, the launch date and trading volume.
Why is QQQ considered risky?
The risk comes from what it holds, not from the fund wrapper. The Nasdaq-100 is concentrated in large technology and growth companies, so it can fall sharply when those stocks fall. The prospectus lists market, index, equity and market trading risks, and QQQM shares them.
What is the 5-year return on QQQM?
It depends on the exact start and end dates and whether dividends are reinvested, so use Invesco’s standardized returns for the current figure. QQQM launched in October 2020, so some charts show a shorter history. Compare QQQ and QQQM over identical dates and you should see very similar results.
Can I switch from QQQ to QQQM?
Yes, you can sell one and buy the other. In a taxable account the sale may create a capital gain, so check the tax cost against the roughly 0.03% annual savings. In an IRA, switching has no tax effect.
Sources
For informational purposes only and is not investment advice. Do not rely on the facts, figures, ticker symbols, or other statements in this article — they may be incomplete, outdated, or incorrect, and we are not responsible for errors. See our disclaimer.