Hold Top 3 Sectors Monthly: A Sector Rotation Strategy You Can Run
By MarketCapLens · Published · 11 min read

A sector rotation strategy systematically shifts exposure between industry groups to favor sectors expected to lead the next stage of the economic cycle. Tactical allocators, active fund managers, and disciplined DIY investors use it to try to beat a static index. The catch: decades of return data suggest the edge often disappears once you subtract trading costs and timing mistakes.
TL;DR:
- Sector rotation strategies face a persistent challenge because their historical edge diminishes once trading costs and timing errors are accounted for.
- Market-based signals like relative strength, earnings revisions, and breadth are more reliable than macroeconomic data for identifying rotation opportunities.
- Using ETFs, a disciplined monthly rebalancing based on momentum and trend filters minimizes concentration risk and keeps transaction costs manageable.
- Empirical evidence suggests that after costs and mistakes, rotation often underperforms simple passive strategies over long periods.
- Successful implementation requires a clear rule set, regular monitoring, and honest tracking of costs and turnover, suited mainly for dedicated investors.
Table of Contents
- How Sector Rotation Works: Mapping Sectors to the Economic Cycle
- Signals and Indicators That Suggest a Sector Rotation Is Underway
- Concrete Sector-Rotation Strategies and When to Use Each
- Portfolio Construction and Execution Details
- Risks, Evidence, and Common Pitfalls
- Step-by-Step Monthly ETF Rotation Example You Can Replicate
- How MarketCapLens Supports Sector-Rotation Monitoring
- Who Should Run This, and When Passive Indexing Wins
- MarketCapLens: A Data Companion for Sector-Rotation Monitoring
- Sources
How Sector Rotation Works: Mapping Sectors to the Economic Cycle
Every business cycle moves through recognizable stages, and different sectors tend to dominate each one. Sector rotation theory holds that early-recovery money flows into cyclical, credit-sensitive names before it ever touches the sectors that dominate a late-stage expansion. The NBER’s business-cycle chronology gives the standard reference points for dating recessions and expansions, which is the backbone most rotation models build on.
Here’s roughly how the leadership pattern tends to play out across a full cycle:
- Early recovery: Financials, consumer discretionary, and industrials often lead as credit loosens and rate cuts feed through to borrowing.
- Mid-expansion: Technology and industrials tend to stay in-line to strong as capital spending and hiring pick up.
- Late-cycle/peak: Energy and materials frequently take over as inflation pressure builds and commodity demand peaks.
- Contraction/defensive phase: Utilities, health care, and consumer staples usually hold up best as earnings growth slows elsewhere.
That pattern is a tendency, not a schedule. Markets are forward-looking, so by the time GDP data confirms a recession, prices in defensive sectors have often already moved. This is the single hardest part of rotation to execute well: the signal you’re watching (economic data) lags the thing you’re trying to trade (price). That’s why most credible frameworks weight market-based signals more heavily than macro releases.
One detail that trips up newer practitioners: sector classification isn’t universal. The Global Industry Classification Standard (GICS), used by S&P and MSCI, defines 11 sectors, but some ETF providers or research shops slice things differently, especially around communication services and technology. Before you build a rotation sleeve, confirm which classification your data source and your ETFs actually use, because a fund labeled “technology” under one taxonomy might hold names that sit in “communication services” under another.
Signals and Indicators That Suggest a Sector Rotation Is Underway
No single indicator reliably calls a rotation. The practical approach is a signal panel: a short list of macro, market, and technical inputs you check on a set schedule and weigh together rather than trading off any single one.
- Rates and the yield curve. A steepening curve after inversion historically precedes early-cycle sector leadership; falling long-term yields tend to favor rate-sensitive growth sectors over financials.
- Inflation and PMI surprises. Purchasing Managers’ Index readings that beat or miss consensus often move cyclical sectors before GDP data catches up.
- Earnings revisions. Analysts raising estimates for a sector ahead of the broader market is one of the more reliable leading signals, since it reflects forward guidance rather than trailing results.
- Relative strength and breadth. Comparing a sector ETF’s price against the S&P 500 over a trailing period (commonly 3, 6, and 12 months) flags which groups are actually gaining ground, not just performing well in absolute terms.
- Flows into sector ETFs. Sustained inflows can confirm institutional rotation already happening rather than one you’re anticipating. Combining macro, market, and technical inputs into one checklist is standard practice among practitioner guides.
Technical filters add discipline on top of that panel. The 10-month simple moving average rule, popularized in Mebane Faber’s momentum research, is a common trend filter: hold a sector only while its price sits above its 10-month SMA, and step aside otherwise. Momentum ranking, where you rank sectors by trailing 6 or 12-month return and hold the top few, is the other workhorse rule, and it pairs well with a breadth check so you’re not chasing a rally driven by two or three mega-cap names.
Pro Tip: Weight market-based signals (relative strength, breadth, earnings revisions) more heavily than macro releases in your voting system. Macro data gets revised and arrives late; price and earnings estimates move first.
The failure mode to watch for is data-snooping, tuning your indicator thresholds until they perfectly explain the last five years. If a rule only “works” when you optimize its parameters after seeing the outcome, it will not survive live trading.
Concrete Sector-Rotation Strategies and When to Use Each
Four templates cover most of what practitioners actually run, and they range from purely macro-driven to fully rule-based.
The economic-cycle model maps your current best guess of the cycle stage to a target sector overweight, then shifts that overweight as leading indicators change. If PMI and credit spreads suggest early recovery, you’d tilt toward financials and discretionary names and trim staples and utilities. The timing window matters here: cycle transitions typically play out over quarters, not weeks, so this model works on a monthly or quarterly review cadence, not a daily one.
Calendar and seasonal tactics lean on documented patterns, like energy strength in certain months or the “sell in May” seasonal drift. These can add a small edge at the margin, but they’re the weakest standalone approach on this list. Seasonality is a statistical tendency across many years, not a rule that holds every year, and it should supplement a stronger signal, not replace one.
Rule-based timing strips out judgment entirely. Two common versions:
- Apply the 10-month SMA filter to each of the 11 GICS sector ETFs and hold only those trading above their average, rebalanced monthly.
- Rank all 11 sectors by trailing 6-month total return and hold the top three or four, rebalanced monthly (a version of Faber’s relative-strength approach).
The systematic multi-signal model is what most institutional desks actually run, and it’s the one worth aspiring to if you have the discipline for it. It combines an economic-backdrop score, a valuation filter, and a momentum ranking into one voting system, so no single input can whipsaw the whole portfolio. A sector only gets overweighted when at least two of the three models agree, which cuts down on false signals from any one indicator having a bad month.
Portfolio Construction and Execution Details
ETFs are the practical building block for nearly every rotation sleeve. Sector ETFs give you diversified exposure to a sector without the stock-picking risk of betting on individual names, and they trade with enough liquidity that execution costs stay manageable for most position sizes.
A few construction rules keep the strategy from becoming a concentrated bet by accident:
- Cap single-sector exposure to a moderate portion of the rotation sleeve, even when your signals point strongly toward one group. Concentration risk compounds fast if a sector-specific shock hits (a rate surprise for financials, an oil shock for energy).
- Rebalance on a fixed monthly schedule, not whenever a signal flickers. Checking signals more often than you trade is fine; trading more often than monthly usually just adds cost without adding edge.
- Use limit orders around the rebalance window rather than market orders, especially on smaller sector ETFs where the bid-ask spread can eat a meaningful chunk of a small gain.
- Size positions using the strength of signal agreement, not equal weighting by default. A sector where all three models in a multi-signal system agree deserves more capital than one flagged by a single indicator.
Tax treatment deserves real attention if you’re trading a taxable account. Monthly rebalancing generates short-term gains, taxed at ordinary income rates in most cases, which is a real drag compared to a buy-and-hold index position. If you’re harvesting losses on a sector you’re exiting, watch the wash-sale rule: repurchasing a substantially identical position within 30 days disallows the loss. Keep a clean trade log with dates, tickers, and rationale, both for your own review and because the IRS will want that paper trail if you’re ever audited. If you’re running this through an advisor or broker, confirm their registration status through FINRA’s BrokerCheck before handing over discretion.
Risks, Evidence, and Common Pitfalls
The honest starting point is that the academic evidence is not kind to rotation strategies. A Massey University analysis of U.S. sector returns from 1948 to 2006 found that business-cycle-based rotation often underperformed simpler passive approaches once realistic trading costs and timing errors were factored in. Nearly six decades of data, and the strategy still struggled to clear the bar a static index sets almost for free.
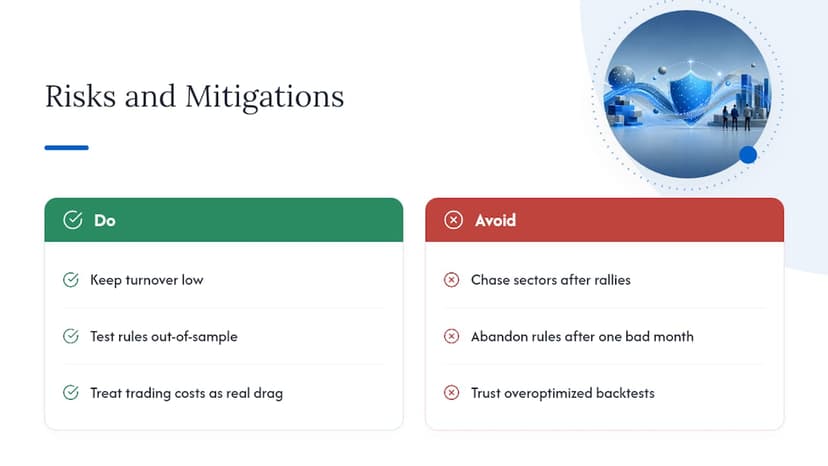
Three things tend to erode the theoretical edge in practice. Turnover and transaction costs compound faster than most investors expect, especially at monthly rebalancing frequency. Behavioral mistakes, like chasing a sector after it’s already rallied or abandoning a rule after one bad month, undo whatever edge the system had on paper. And over-optimized backtests, models tuned to fit history perfectly, routinely fall apart the moment they meet live, out-of-sample data.
The mitigation isn’t complicated: keep turnover low, test any rule on a period you didn’t use to build it, and treat cost drag as a real number to beat, not an afterthought.
Step-by-Step Monthly ETF Rotation Example You Can Replicate
Here’s a simplified version of a rule-based rotation you can run with a spreadsheet and a brokerage account.
- Pick your universe. Use the 11 GICS sector ETFs (technology, financials, health care, industrials, energy, materials, utilities, consumer discretionary, consumer staples, real estate, communication services).
- Define your signal panel. Trailing 6-month total return (momentum) plus the 10-month SMA filter (trend confirmation).
- Set a number-of-winners rule. Hold the top 3 sectors by momentum, but only if they’re also trading above their 10-month SMA. If fewer than 3 qualify, hold cash or a broad-market ETF for the remainder.
- Execute on a fixed date each month, say the first trading day, using limit orders near the prior close.
- Record the trade and the rationale, then repeat next month.
An illustrative month might look like this:
| Rank | Sector ETF (example) | 6-Month Return | Above 10-Month SMA? | Action |
|---|---|---|---|---|
| 1 | Technology | +10.5% | Yes | Hold, top 3 sectors |
| 2 | Industrials | +8.3% | Yes | Hold, top 3 sectors |
| 3 | Financials | +6.9% | Yes | Hold, top 3 sectors |
| 4 | Energy | +5.7% | No | Excluded |
This is an illustrative sequence, not a backtest result, and real returns will vary with the exact ETFs, dates, and costs you use. Track your first 12 months against a simple benchmark like the S&P 500 or an equal-weight sector index, and check turnover and realized costs at the end of that period before deciding whether to scale the approach up. You can build the candidate watchlist for a run like this using industrials rankings or a consumer cyclical breakdown to see current sector composition and leadership before you commit capital.
How MarketCapLens Supports Sector-Rotation Monitoring
Running a signal panel requires clean, current sector data, and that’s the practical gap Marketcaplens fills. The platform tracks over 2,500 companies with sector breakdowns and rankings updated multiple times daily, which matters when you’re checking relative strength or watching for leadership shifts before they show up in slower macro data.
A few pages fit directly into the workflow described above:
- Sector ranking pages (industrials, consumer defensive, consumer cyclical) show current market-cap leadership within a sector at a glance.
- Theme pages like AI Stocks work as a template for building a custom watchlist around any sector or sub-theme you’re rotating into.
- Company-level pages let you drill into individual constituents once a sector signal fires, so you’re not rotating blind into a basket you haven’t inspected.
A weekly check-in on sector rankings, paired with a monthly snapshot export for your own records, is enough cadence for most rotation sleeves without turning into a full-time job.
Who Should Run This, and When Passive Indexing Wins
Sector rotation rewards investors who can commit real time to it: tactical allocators, institutions with dedicated research staff, and disciplined DIY investors willing to follow a written rule set even when it feels wrong. If you can’t commit to checking signals on a fixed schedule and following them without second-guessing, a passive core is the better call.
Ask yourself three questions before building a sleeve: Can you tolerate underperforming the index for a full year while a rule proves out? Will you track and report your own turnover and costs honestly? Do you have at least an hour a month for review? A “no” to any of those points toward staying passive, or running rotation as a small satellite, not the whole portfolio.
— MarketCapLens
MarketCapLens: A Data Companion for Sector-Rotation Monitoring
Building the signal panel this article describes means checking sector leadership and rankings often, and that’s exactly what Marketcaplens is built for.

The platform’s sector breakdowns, market-cap rankings, and time-series performance data update multiple times daily across more than 2,500 companies, so you’re working from current numbers instead of a stale weekly export. That matters most in the exact moment rotation strategies live or die: catching relative strength shifts before they’re obvious to everyone else. Use the industrials rankings or AI stocks page to build your candidate watchlist, then check individual constituents like Meta or Applied Materials before committing capital to a sector overweight. Start by browsing current sector rankings on MarketCapLens to see where market-cap leadership sits today.
Sources
For deeper reading beyond this guide, the Massey University study is the key empirical check on rotation’s real-world returns. Investopedia’s guides on cycle mapping and ETF implementation cover mechanics in more depth, and a step-by-step sector-analysis guide walks through spotting emergent leadership early.
This article is general information, not a substitute for advice from a qualified financial advisor. Consult a qualified financial professional about your own circumstances before acting on anything here.
Recommended
For informational purposes only and is not investment advice. Do not rely on the facts, figures, ticker symbols, or other statements in this article — they may be incomplete, outdated, or incorrect, and we are not responsible for errors. See our disclaimer.