Short Interest Explained: What It Measures and How to Read It
By MarketCapLens · Published · 12 min read
Short interest is the number of a company’s shares that investors have sold short and not yet bought back. It is a count of open bets against a stock, taken on a set date. Read as a share of the float or as days to cover, it shows how pessimistic traders are and how crowded that trade has become. Read alone, it tells you very little about whether the stock will fall. The number only becomes useful when you set it against the company’s size, its trading volume and its sector. That is the job of a market cap lens.
This guide covers what short interest counts, how it is reported in the United States, how to calculate short interest as a percentage and days to cover, and how to read a figure like 6% or 20%.
MarketcaplensPut Short Interest in Market ContextCompare company market caps, sector breakdowns, share prices, and historical data to add context when researching stock market trends.VisitTL;DR
- Short interest is a snapshot of open short positions on a given settlement date, not a count of short selling that day.
- In the U.S., FINRA collects it twice a month and publishes it with a lag of about seven business days, so the figure you see is always somewhat old.
- Short interest as a percent of float tells you how crowded the bet is. Days to cover (short interest divided by average daily volume) tells you how hard it would be to exit.
- A high number signals pessimism and potential squeeze risk. It does not predict a decline by itself.
- Compare short interest with float, volume, company size and sector peers before drawing a conclusion.
Table of Contents
- What short interest actually counts
- How and when short interest is reported in the U.S.
- How to calculate short interest, short float and days to cover
- What short interest tells you
- Is 6% high? Is 20% a lot?
- Why company size changes the reading
- Common mistakes when reading short interest
- Where MarketCapLens fits
- Our perspective
- FAQ
- Sources
What short interest actually counts
To sell a stock short, a trader borrows shares, sells them and hopes to buy them back later at a lower price. The trader pockets the difference. If the price rises instead, the loss has no fixed ceiling, because a stock can keep climbing.
Until the borrowed shares are bought back (“covered”), the position is open. Short interest is the total of all such open positions.
FINRA, the self-regulatory body that oversees U.S. brokerage firms, defines short interest as a snapshot of the total open short positions on the books and records of brokerage firms, for all exchange-listed and over-the-counter equities, on a given settlement date. Two details in that definition matter:
- It is a stock, not a flow. It measures positions that exist on a date, not how much short selling happened during a day or week.
- It is a snapshot. Positions can be opened and closed between reporting dates, and the published number will not show that.
The reported figure comes from firms’ books under Rule 200 of Regulation SHO, the SEC rule that governs how short sales are marked and handled. FINRA’s data glossary describes the “current short” field as the shares reflected on reporting firms’ books as short under that rule on the cycle’s settlement date.
Short interest is not short sale volume
This is the most common mix-up. FINRA also publishes a daily file of short sale volume, which counts short-sale trades on individual trade dates. FINRA says plainly that position data is a snapshot on two discrete days each month, while volume reflects aggregate trades, and that sites relabeling the volume file as “short interest” are incorrect.
A stock can show heavy short sale volume on a day when traders are simply providing liquidity, trading in and out within hours. None of that necessarily adds to open short interest. If a chart claims to show “daily short interest,” check which one it really is.
How and when short interest is reported in the U.S.
Brokerage firms must keep records of total short positions across customer and proprietary accounts in all equity securities and report them to FINRA. FINRA Rule 4560 sets the deadline at no later than the second business day after the designated reporting settlement date.
The schedule follows a steady rhythm:
- Mid-month report: positions held on the settlement date of the 15th, or the previous business day if the 15th is not a settlement date.
- End-of-month report: positions held on the last business day of the month.
- Publication: the seventh business day after the settlement date, per the FINRA glossary.
FINRA posts the exact settlement, due and publication dates for each year on its short interest reporting page. Check it for the current calendar, since holidays shift the dates.
The practical consequence is a lag. A position counted on the 15th is not public until about ten calendar days later. In a fast market, traders may have covered or added a lot by then. This is the same issue we describe in our piece on real-time versus end-of-day data: the age of a number matters as much as its value.
The newer SEC reporting rule
A second layer of data now exists. In October 2023, the SEC adopted Rule 13f-2 and Form SHO, effective January 2, 2024. Large institutional investment managers must report monthly short positions once they cross a threshold. For companies that file reports with the SEC, the threshold is a monthly average daily gross short position of $10 million or more, or 2.5% or more of shares outstanding. For other issuers it is $500,000 or more on any settlement date.
The SEC said it would publish aggregated, anonymized data on large short positions within four weeks after month-end, along with net daily short activity, as set out in the Chair’s statement on the rule. Individual managers are not named. For most readers, the twice-monthly FINRA figure remains the headline number, and the SEC data adds context.
How to calculate short interest, short float and days to cover
Three numbers come up again and again. Here they are with one worked example.
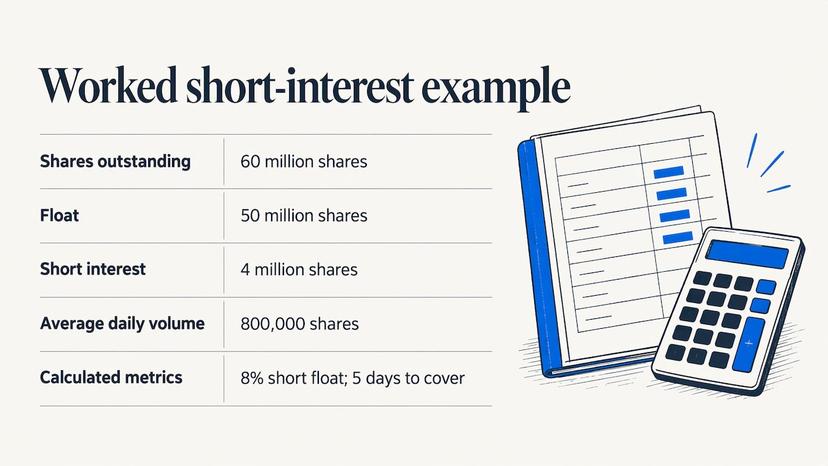
Suppose a company has 60 million shares outstanding, of which 50 million are in the float (shares actually available to trade, excluding those held by insiders and other restricted holders). Reported short interest is 4 million shares, and average daily volume is 800,000 shares.
Short interest as a percent of float
The formula is simple:
Short interest ÷ float × 100
In the example, 4 million ÷ 50 million = 8% of float.
People also write “short float,” “short percent of float” and “short interest ratio” loosely. In practice, short interest is the raw share count, while short float is that count expressed as a percentage of the float. The difference between short interest and short float is just the division. The denominator is the part to watch. Some sources divide by shares outstanding instead of float, which gives a smaller percentage. In the example, 4 million ÷ 60 million is 6.7%. Always check which denominator a page uses before you compare two stocks. Our explainer on shares outstanding versus float shows why the two can differ a lot.
Days to cover
FINRA’s glossary defines days to cover as the number of days of average share volume it would take to buy back all shares sold short. The formula is short interest ÷ average daily share volume, rounded to hundredths. FINRA displays 1.00 for values of 1 or below and N/A when average daily volume is zero. FINRA’s own example: 40 million shares short with 20 million average daily volume gives 2 days.
In our example, 4 million ÷ 800,000 = 5 days. If every short seller tried to exit and bought, say, a fifth of the stock’s normal daily volume, it would still take days, and the buying itself would push the price up.
You will also see this called the “short interest ratio.” The FINRA glossary says average daily volume is total (or split-adjusted) volume divided by the number of trade days between the previous settlement date plus one and the current settlement date. Other sites may use a 30-day or 90-day average, so two sites can show different days-to-cover figures for the same stock on the same day.
Change from the prior report
FINRA also publishes a percent change field: current cycle short interest minus the previous cycle’s, divided by the previous cycle’s, times 100. The direction can matter more than the level. A stock at 8% that was at 4% two weeks ago tells a different story from one that has sat at 8% for a year.
| Metric | Formula | What it tells you |
|---|---|---|
| Short interest | Shares sold short and not yet covered | Size of the open bet |
| Short float (% of float) | Short interest ÷ float × 100 | How crowded the bet is |
| Days to cover | Short interest ÷ average daily volume | How long an exit could take |
| Change vs. prior report | (Current − previous) ÷ previous × 100 | Whether pessimism is rising or fading |
What short interest tells you
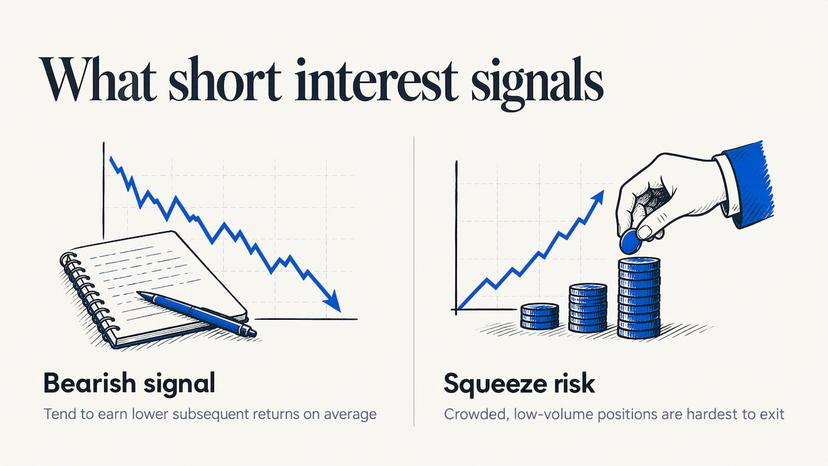
Short interest is a sentiment gauge. Short sellers are often professionals who have researched a company, so a rising count suggests that informed money sees trouble. Academic work backs this up in aggregate: one widely cited study of the “short interest effect” found that heavily shorted stocks tend to earn lower subsequent returns, because short sellers appear able to anticipate bad news and negative earnings surprises.
That is an average across many stocks and many years. For any single company, it is a signal to investigate, not a forecast. Short sellers are wrong often enough, and a position can persist for years while a stock climbs.
Short interest also cuts the other way. Heavily shorted stocks can be vulnerable to a short squeeze: good news arrives, the price rises, short sellers rush to buy back shares to limit losses, and that buying pushes the price higher still. The combination of high short float and high days to cover is what makes a squeeze possible, because crowded positions with little trading volume are the hardest to exit.
Is 6% high? Is 20% a lot?
Readers ask this constantly, and no official body sets a line. The honest answer is that it depends on the stock, but you can reason about it:
- Low single digits is common for large, liquid companies and rarely signals anything unusual.
- Mid to high single digits deserves a look, particularly if the number has been rising across several reports. A figure around 6% is not alarming for many stocks, but it is worth comparing with the sector.
- Double digits, and especially 20% or more, means a large share of the tradable stock is borrowed and sold. That signals strong skepticism, and it also raises squeeze risk. It does not mean the company is failing.
Three checks turn a raw percentage into a judgment:
- Compare with peers. Some industries, such as those with unprofitable growth firms or heavy debt, tend to carry more short interest than others. Looking at companies within the same group on our sector pages gives you a baseline.
- Check days to cover. 15% short float on a stock that trades heavily is a different situation from 15% on a thin one.
- Check the trend and the date. Compare the last several reports, and remember the data is already about ten days old when published.
Why company size changes the reading
Short interest percentages are not equally meaningful across the market. A mega-cap stock with billions of shares trading each day can carry a large dollar value of short interest and still have a small float percentage and a very low days-to-cover. A small-cap with a thin float can be squeezed by comparatively modest buying.
That is why market capitalization (share price times shares outstanding) belongs in the analysis. Before judging a short interest figure, ask where the company sits in the rankings, how big its float is in dollars and how it compares to similar-sized neighbors. Our market cap calculator turns price and share count into company size in seconds.
Size also helps you decide how much to risk. A volatile, heavily shorted small-cap may call for a smaller position than a stable large-cap. Our position size calculator works out a share count from the amount you are willing to lose.
Common mistakes when reading short interest
- Treating it as current. It is a snapshot on a settlement date, published days later.
- Mixing up volume and positions. Daily short sale volume is not short interest.
- Comparing different denominators. Percent of float and percent of shares outstanding are not interchangeable.
- Assuming a high number means a coming drop. It means skepticism, and sometimes it means a squeeze setup.
- Ignoring context. A rising number alongside a rising price may mean shorts are losing, not winning.
Where MarketCapLens fits
Short interest answers one question: how many people are betting against this stock? To use that answer, you need the rest of the picture: how large the company is, how its price has moved and whether the whole sector is under pressure.
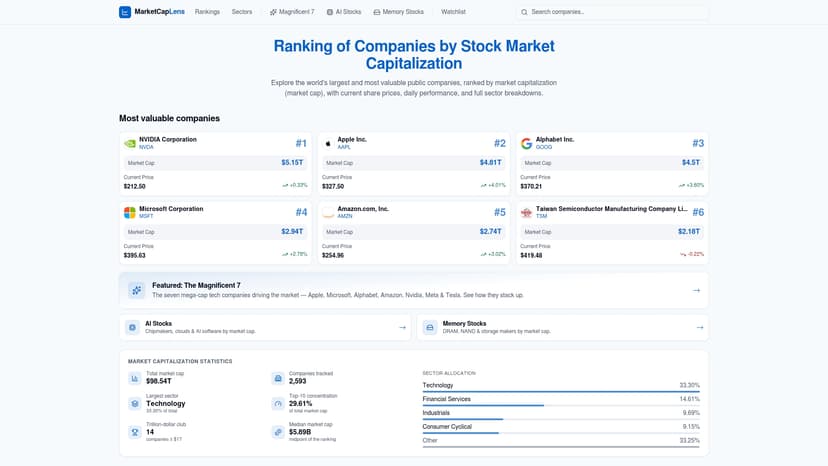
MarketCapLens tracks more than 2,500 public companies ranked by market capitalization, with share prices and sector breakdowns refreshed multiple times a day. Start with the market cap rankings to see where a heavily shorted name sits in its peer group, then use the daily market performance view to see whether a move is broad or concentrated in a few large stocks.
If you are sizing up a trade, our free stock calculators cover position size, average cost and valuation.
Our perspective
Short interest is one of the few market numbers that tells you what other participants are doing with real money. We also think it is one of the most misread, because it is almost always quoted without context.
The context we care about is size and breadth. A 10% short float on a company that sits near the top of the market cap rankings is a different thing from 10% on a company near the bottom of our 2,500-plus list. Sector matters too: when a whole group is heavily shorted, the cause is often the industry’s economics rather than one company’s failings.
That is why we built MarketCapLens around rankings, sector breakdowns and daily performance together. Our data refreshes multiple times a day so you can see how a stock is trading right now, while the short interest figure from FINRA tells you what positioning looked like on its last settlement date. The two together are more informative than either alone.
Our advice is to use short interest as the start of a research question, not its answer.
MarketCapLens
FAQ
What is a good short interest ratio?
There is no official “good” level. The short interest ratio is usually days to cover, meaning short interest divided by average daily volume. Lower values mean shorts could exit quickly, while higher values, often several days or more, mean a crowded position that is harder to unwind. Judge it against the stock’s peers and its own history.
What is the difference between short float and short interest?
Short interest is the raw number of shares sold short and not yet covered. Short float expresses that number as a percentage of the float, the shares available for public trading. Check the denominator when comparing sources, since some pages divide by total shares outstanding instead.
How often is short interest updated?
In the U.S., FINRA collects short interest twice a month, for the 15th and the last business day, and publishes each report about seven business days after the settlement date. Between releases, the figure does not change, even if actual positions do. FINRA’s reporting page lists the exact dates for each year.
Does high short interest mean a stock will fall?
Not by itself. On average, heavily shorted stocks have tended to lag, which is why traders watch the number. But any single stock can rise, and a rising price can force short sellers to buy back shares, which can drive a squeeze. Treat a high figure as a reason to look closer at the company.
Sources
- Short Interest – What It Is, What It Is Not (FINRA)
- Equity Short Interest Data Glossary (FINRA)
- Rule 4560, Short-Interest Reporting (FINRA)
- Short Interest Reporting calendar (FINRA)
- SEC final rule 34-98738, Short Position and Short Activity Reporting
- SEC Chair statement on short sale rules, October 13, 2023
- Short Interest Effect, Long-Short Version (Quantpedia)
Recommended
For informational purposes only and is not investment advice. Do not rely on the facts, figures, ticker symbols, or other statements in this article — they may be incomplete, outdated, or incorrect, and we are not responsible for errors. See our disclaimer.