SMA vs. EMA: How the Two Moving Averages Differ
By MarketCapLens · Published · 11 min read
The simple moving average (SMA) gives every day in its window the same weight. The exponential moving average (EMA) gives recent days more weight, so it turns sooner when price changes direction. Neither is better in every case: the SMA is steadier, the EMA is quicker, and the right choice depends on how fast you need the line to react and how much noise you can tolerate. Below you get the formulas, a worked example with real arithmetic, the common periods, and a way to decide. We also show how to put either average in context with market cap and sector data on MarketCapLens.
MarketcaplensPut Moving Averages in Market ContextCompare company rankings, share price data, and sector breakdowns to see moving-average signals alongside broader market trends.VisitTL;DR
- An SMA adds the last N closing prices and divides by N, so each day counts equally. An EMA multiplies the newest price by a smoothing factor, so recent days count for more.
- The EMA reacts faster and gives earlier signals but more false ones. The SMA lags more but is smoother.
- Period matters more than type: a 20-day line and a 200-day line answer different questions, whichever formula you use.
- Use the SMA for the big picture and the EMA for shorter-term timing, or plot both and watch where they agree.
- A moving average describes past prices. Read it together with company size, sector and volume, not alone.
Table of Contents
- What a moving average does
- How an SMA is calculated
- How an EMA is calculated
- SMA vs. EMA side by side
- Which periods people use
- Which is better: SMA or EMA?
- Limits worth knowing
- Putting the average in context with market cap and sector
- From the MarketCapLens desk
- Check the signal against the rankings
- FAQ
- Sources
What a moving average does
A moving average replaces a jagged price series with one smoother line. For each day, it takes the prices over the last N periods and condenses them into a single number. The next day the window slides forward by one period, so the line keeps updating. N is the “period” or “length”: a 50-day average uses the last 50 daily closes.
Because the line is built from past prices, it always trails the market. The longer the period, the smoother the line and the larger the lag. That trade-off between smoothness and speed is the whole difference between an SMA and an EMA, and between a 10-day and a 200-day average.
Analysts use moving averages in two main ways. CME Group’s technical analysis course notes that they can be plotted on several time frames and compared with price to spot possible support and resistance areas. It also describes crossovers, where a short-period average moves through a longer one, as a common signal. Both uses work with either type.
The data behind the line matters too. Most charts build averages from closing prices, which is why the closing price versus intraday price distinction is worth knowing before you compare numbers across platforms.
How an SMA is calculated
The SMA is the plain arithmetic mean. CME Group’s guide calculates it by summing the last x closing prices and dividing by the number of days.
Take a stock that closed at $50, $52, $51, $53 and $54 over five days:
- Sum: 50 + 52 + 51 + 53 + 54 = 260
- 5-day SMA: 260 ÷ 5 = $52.00
Now day six closes at $60. The oldest price ($50) drops out and $60 enters:
- Sum: 52 + 51 + 53 + 54 + 60 = 270
- 5-day SMA: 270 ÷ 5 = $54.00
Two features show up here. First, a $10 jump in price moved the average only $2, because the new price is one fifth of the total. Second, the average falls or rises when an old price leaves the window, not only when a new one arrives. That “drop-off effect” can make an SMA jump on a day when nothing new happened in the market.
How an EMA is calculated
The EMA starts with a smoothing multiplier. CME Group gives the standard multiplier as 2 ÷ (1 + period), and illustrates a 14-day multiplier of 0.133. The EMA for a day is then:
EMA = (today’s close × multiplier) + (yesterday’s EMA × (1 − multiplier))
The first EMA value has no prior EMA, so the usual practice is to seed it with an SMA of the same length. Using our five-day example:
- Multiplier: 2 ÷ (1 + 5) = 0.3333
- Seed: the 5-day SMA of $52.00
- Day six close of $60: (60 × 0.3333) + (52 × 0.6667) = 20.00 + 34.67 = $54.67
The EMA moved to $54.67, while the SMA moved to $54.00. The newest price carries a third of the weight in the EMA and a fifth in the SMA. That is the gap in a single step. Over many days it shows up as an EMA line that hugs price more tightly.
Note that the EMA never fully forgets old prices. Their weight shrinks every day but does not hit zero, which also means the EMA has no drop-off effect: old prices fade out gradually instead of vanishing at once.
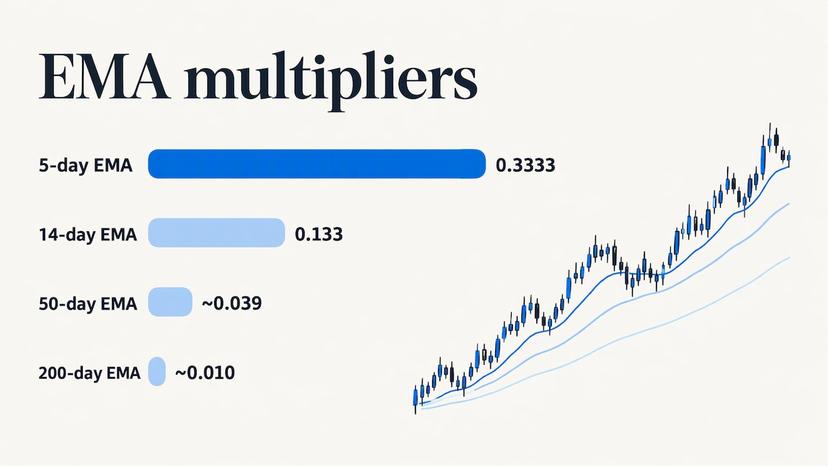
Longer periods give smaller multipliers. A 50-day EMA uses 2 ÷ 51, about 0.039, so each new close contributes roughly 4% of the new value. A 200-day EMA uses about 0.010, or 1%. That is why long-period lines move slowly whichever type you pick.
SMA vs. EMA side by side
| Feature | SMA | EMA |
|---|---|---|
| Weighting | Equal across the window | Heavier on recent prices |
| Reaction to a price move | Slower | Faster |
| Smoothness | Smoother | Slightly more reactive |
| Old prices | Drop out abruptly at the end of the window | Fade gradually, never reach zero |
| Early signals | Fewer, later | Earlier, with more false starts |
| Math | Simple mean | Recursive formula with a multiplier |
| Typical use | Long-term trend, broad support and resistance | Shorter-term timing, momentum |
When price trends steadily, both lines point the same way and the difference is small. They separate when price changes direction. At a turn, the EMA bends first and the SMA follows later. At a sudden spike that reverses, the EMA will have moved more and will give more back.
Which periods people use
The period you choose changes the reading more than the type does. CME Group’s support-and-resistance guide lists common moving-average lengths of 9, 21, 50, 100 and 200 periods, and notes that shorter averages generally provide weaker support or resistance than longer ones.
A rough guide to what each length tends to describe on a daily chart:
- 9 to 21 days: short-term momentum, the kind a swing trader watches.
- 50 days: the intermediate trend, roughly the last two and a half months of trading.
- 100 to 200 days: the long-term trend, what position investors and analysts use to separate a bull phase from a bear phase.
When readers ask what a “50 EMA” means, the answer is simply an exponential average over the last 50 periods. On a daily chart that is 50 trading days. On an hourly chart it is 50 hours. Always check the chart’s time frame before reading the line.
Crossovers
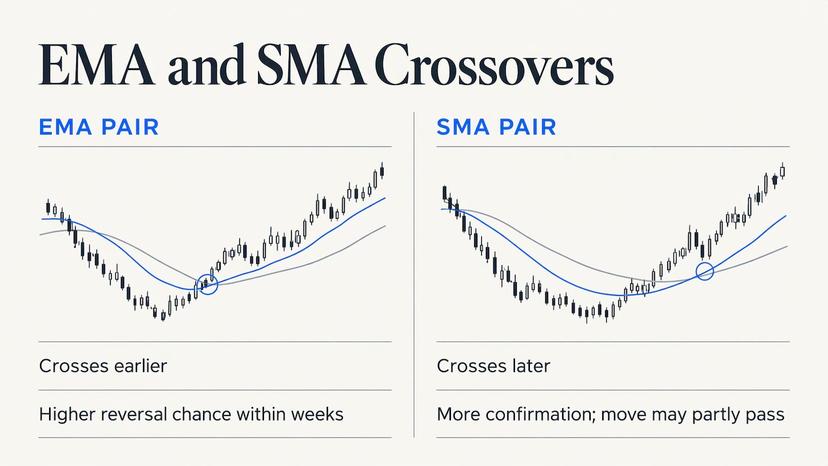
A crossover is the most common signal. CME Group describes a short-period average crossing above a longer-period one as generally bullish, and crossing below as generally bearish. The same guide gives a 50-EMA crossing above a 200-EMA as an example generally read as a sign that price may continue upward.
The type affects timing. An EMA pair crosses earlier than an SMA pair with the same lengths. An earlier cross means an earlier signal, and also a higher chance that the cross reverses within a few weeks. A later SMA cross has had more time to confirm the move, and a good part of it may already be behind you.
Which is better: SMA or EMA?
The honest answer is that it depends on the question you are asking. Use this as a decision guide.
Choose the SMA when:
- You want a steady view of the long-term trend and care less about the exact day it turns.
- You are marking long-term levels, such as a 200-day line, that many market participants watch.
- You want a number that is easy to reproduce by hand or in a spreadsheet.
- The stock is volatile and you want fewer whipsaws.
Choose the EMA when:
- You want earlier warning that momentum is changing.
- You are working on shorter time frames, where a few days of lag is a big share of the move.
- Recent earnings, news or a sector rotation have changed the picture and older prices say less about it.
Use both when: you want a cross-check. If a stock sits above both its 50-day SMA and its 50-day EMA, the trend reading is firm. If it sits between them, the signal is mixed, and that is useful information too.
Matching the choice to the job
A business student comparing the long-term trend across sectors will do well with 50- and 200-day SMAs, since the lines are easy to compute and compare. An analyst tracking how a stock reacted to a quarterly report will get more from a 9- or 21-day EMA, which responds within days. An investor reviewing a core holding once a month can use either, as long as the period stays the same from one review to the next. Changing both type and period at once makes comparisons over time meaningless.
Limits worth knowing
Both averages are lagging indicators. They summarize what has happened, not what will happen. A crossover is an observation about past prices, and prices can reverse right after one. In a sideways market, both lines flatten and cross back and forth, producing signals that lead nowhere. The EMA does this more often because it is more sensitive.
Two habits reduce errors:
- Confirm with another input. Volume, the stock’s sector trend and the broader index tell you whether a cross is isolated or part of a wider move.
- Fix your settings in advance. Pick the type and period before you look at the chart, so you do not tune the line to match the story you already believe.
Nothing here is investment advice. Moving averages are a way to read price history, and any decision to buy or sell should rest on your own research and, where needed, a licensed financial adviser.
Putting the average in context with market cap and sector
A moving average tells you where price has been relative to its recent history. It does not tell you how big the company is, how it ranks among peers or whether its whole sector is moving. Those facts change how much weight to give a signal. A cross on a mega-cap that moves with the index means something different from the same cross on a small company with thin trading.
A simple workflow:
- Find the company’s market cap rank and see which size group it belongs to.
- Check how its sector is performing, so you can tell whether the stock leads or follows.
- Plot a 50-day and a 200-day average, as SMA, EMA or both.
- Compare the position of price against both lines with the sector’s direction.
The five-step method in our stock market trend analysis guide walks through this kind of process. If you use shorter periods, the data’s freshness matters too: a line fed by delayed quotes will trail even more, and the piece on real-time versus end-of-day data explains how much a delay changes what you see. For long-term charts, the choice between log and linear axes affects how a 200-day line looks against a price that has multiplied.
From the MarketCapLens desk
Moving averages answer one question: where has price been? Most investors also need to know where a company stands. How large is it, which sector does it belong to, and is the whole group moving or only this name?
That is why we built MarketCapLens around the market cap ranking. We track over 2,500 companies, refresh share prices and performance data multiple times daily, and break companies out by sector, so a signal on one chart can be checked against its peers in a minute.
Our view on SMA versus EMA is practical. Pick the one that matches your time frame, keep the period fixed, and test the reading against size and sector context before acting. A 200-day line on a company in the top of the rankings and the same line on a small cap are not the same evidence.
We write these guides in plain English because the math is the easy part. Knowing what to compare it with is where the work is.
MarketCapLens
Check the signal against the rankings
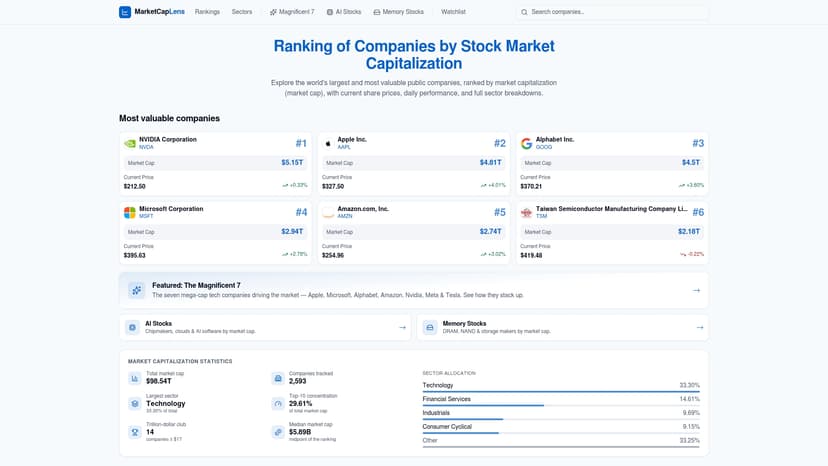
Once your moving average points somewhere, the next step is seeing how the company stacks up. The MarketCapLens rankings list public companies by market capitalization with daily performance, and the sector pages show how each group is ranked, so you can tell whether a trend is company-specific or sector-wide. If you want to work out a company’s size yourself from price and share count, the market cap calculator does it in one step.
For US-listed stocks, the market hours calculator also helps you know when the daily close, the price most moving averages are built on, is set.
FAQ
Is the EMA more accurate than the SMA?
Neither is more accurate, because both are correct calculations of different things. The EMA weights recent prices more, so it follows price more closely. The SMA weights all prices in the window equally, so it describes the whole period. Which fits better depends on whether you care about speed or smoothness.
Which EMA setup is best?
There is no single best setup. Commonly used lengths include 9, 21, 50, 100 and 200 periods, according to CME Group. Short lengths suit timing on short time frames, and longer ones suit trend direction. Pick lengths that match how long you hold a position and keep them consistent.
What does the 50 EMA mean?
It is an exponential average of the last 50 closing prices on your chart’s time frame, which is 50 trading days on a daily chart. Price above it suggests the intermediate trend is up, and price below it suggests it is down. Its smoothing multiplier is about 0.039, so each new close adds roughly 4% to the value.
Can I use the SMA and EMA together?
Yes. Plotting both with the same period shows how much recent prices differ from the full window. When the EMA sits well above the SMA, recent prices have been higher than the window average. When the two lines are close, the trend is steady.
Why do my SMA and EMA values differ from another chart?
Common causes are a different price input (closing versus intraday), a different time frame, or a different seed value for the EMA. Check that the period, the time frame and the price field match before comparing numbers.
Sources
Recommended
For informational purposes only and is not investment advice. Do not rely on the facts, figures, ticker symbols, or other statements in this article — they may be incomplete, outdated, or incorrect, and we are not responsible for errors. See our disclaimer.