Blog
Investors: 4 Steps to Choose Small vs Mid Cap (10–25% Allocation Bands)
By MarketCapLens · Published · 13 min read

Small-cap stocks trade higher growth potential for sharper volatility and thinner trading volume; mid-cap stocks trade some of that upside for steadier footing and better analyst coverage. Investors typically benchmark small caps against the Russell 2000 and mid caps against the S&P MidCap 400. If you want more swing and can stomach deeper drawdowns, lean small. If you want growth without quite as much stomach-churning, mid cap is usually the better fit.
TL;DR:
- Small-cap stocks generally have market values between $250 million and $2 billion, offering higher growth potential but with more volatility and less analyst coverage than mid caps.
- Mid-cap stocks typically range from $2 billion to $10 billion, providing a balance between growth opportunities and more stable trading conditions.
- The universe of small and mid caps is defined differently by index providers, with frequent classification changes influenced by market movements and rebalancing.
- Small caps tend to be more vulnerable to liquidity issues, wider bid-ask spreads, and a thinner analyst coverage gap, which can increase trading costs and risk.
- Long-term, small caps have historically outperformed large caps, but their returns are episodic and highly sensitive to economic cycles and sector concentration.
MarketcaplensTrack Small And Mid Cap TrendsCompare market capitalization, share prices, historic data, and sector breakdowns across thousands of public companies.Explore market data
Table of Contents
- Small vs. Mid Cap: Definitions and Dollar Cutoffs
- Benchmarks and Examples Investors Actually Use
- Volatility, Liquidity, and Risk: The Real Trade-Offs
- When Small Caps Win, When Mid Caps Win
- How to Choose Between Small-Cap and Mid-Cap Exposure
- Trading Costs, Taxes, and Rebalancing in Practice
- How MarketCapLens Tracks Companies Moving Between Tiers
- A Disciplined Way to Think About Small vs. Mid Cap
- Track Small- and Mid-Cap Movements With MarketCapLens
- Sources
- FAQ
Small vs. Mid Cap: Definitions and Dollar Cutoffs
Market capitalization is share price multiplied by shares outstanding. It is a simple formula, but the number it produces does a lot of work: it acts as a stand-in for how liquid a stock is, how many analysts bother to cover it, and how mature the underlying business tends to be.
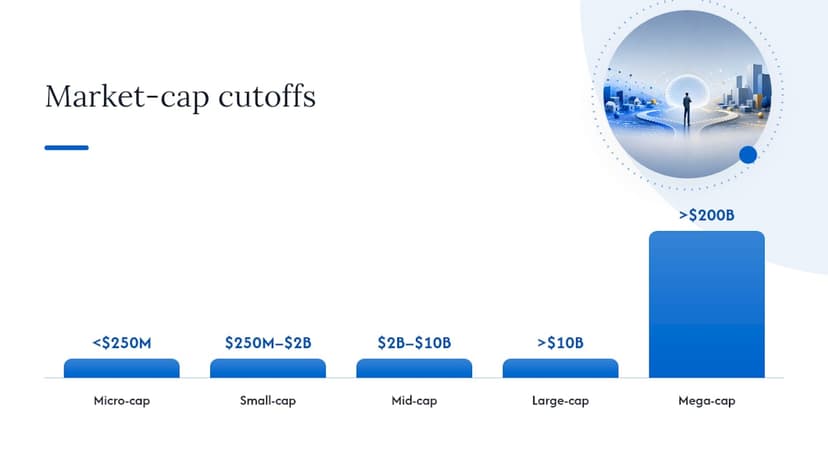
Small-cap companies generally run from about $250 million to $2 billion in market value, while mid-cap companies sit roughly between $2 billion and $10 billion, according to common industry definitions. Large caps pick up above that. These numbers are not carved in stone. Different providers slide the lines around depending on their methodology, and Fidelity’s own investor education points out that cutoffs vary enough between index providers so that comparing two “small-cap” funds can mean comparing two different universes of stocks.
A few things worth knowing about how these tiers actually work:
- Micro-cap sits below small-cap, usually under $250 million to $300 million, and carries even thinner liquidity and coverage than small-cap proper.
- Mega-cap sits at the top, generally above $200 billion, and includes the handful of companies that dominate major indexes.
- Cutoffs drift with the market. A bull run can push a mid-cap into large-cap territory without the company doing anything different operationally.
- Index providers reclassify stocks periodically, so a stock’s “size label” can change even when its business hasn’t.
Understanding the mechanics behind these tiers matters more than memorizing the dollar figures, since the figures themselves move. For a deeper breakdown of every size tier from micro to mega, MarketCapLens’s full explanation of market-cap tiers walks through where each boundary sits and why.
Benchmarks and Examples Investors Actually Use
You can’t compare small-cap and mid-cap performance without knowing which index you’re looking at, because the two major approaches to building these indexes produce noticeably different universes.
The Russell 2000 tracks small-cap stocks using a strict percentile-based method: it takes the 2,000 smallest companies among the largest 3,000 U.S. stocks and mechanically rebalances every year. The S&P MidCap 400 and S&P SmallCap 600 work differently. A committee selects constituents based on liquidity, financial viability, and sector representation, not just size rank.
That construction difference has real consequences, one of MarketCapLens’s core insights on the topic: percentile-based indexes reclassify large numbers of companies whenever the market moves, while committee-based indexes stay more stable but represent a curated subset rather than a pure size slice.
What do you actually find inside each tier? A few illustrative patterns:
- Small-cap indexes tend to be loaded with regional banks, specialty retailers, and early-stage industrial or biotech names still proving out their business models.
- Mid-cap indexes lean toward companies that have already survived their scaling phase: established regional healthcare systems, mid-tier consumer brands, and industrial suppliers with multi-decade track records.
- Both tiers include far more cyclical and domestically focused businesses than the large-cap indexes, which skew toward multinational giants.
If you want to see where individual companies currently rank, MarketCapLens’s live market-cap rankings update multiple times daily and let you watch names move between tiers in real time.
Volatility, Liquidity, and Risk: The Real Trade-Offs
This is where the small vs. mid cap decision gets concrete. The differences aren’t cosmetic. They show up in your trading costs, your portfolio’s swings, and how much information you actually have when you buy.
Volatility runs higher for small caps. Long-run U.S. data shows small caps swing harder in both directions than mid or large caps, a pattern tied to the historical premium small caps have earned over full market cycles. That extra return has historically come with materially deeper drawdowns during downturns.
Liquidity is the underrated risk. Small-cap stocks typically trade with thinner volume, and wider bid-ask spreads than mid- or large-cap names mean you pay more just to get in and out of a position. A large institutional buyer trying to build a stake in a small-cap name can move the price against themselves simply by placing the order. Mid caps generally trade with tighter spreads and deeper order books, though nowhere near the depth of large-cap names.
Coverage gap: Small caps carry noticeably thinner analyst coverage than mid- or large-cap stocks, which widens the information gap between institutional and individual investors and helps explain the wider spreads.
Analyst coverage thins out fast below mid-cap. A large-cap company might have twenty analysts publishing estimates. A small-cap name might have two, or none. That coverage gap cuts both ways: less scrutiny means more chances for genuine mispricing, but it also means less independent verification of what management tells you.
Business and financing risk climb as size falls. Smaller companies have less access to cheap capital, fewer product lines to fall back on if one struggles, and shorter track records surviving a full recession. A few practical distinctions worth keeping in mind:
- Small caps are more sensitive to credit tightening because they rely more heavily on bank loans and short-term financing than public bond markets.
- Mid caps usually have at least one demonstrated growth cycle behind them, which gives you more operating history to evaluate.
- Sector concentration in small-cap indexes (financials and industrials, historically) can quietly load up your risk in ways a quick glance at “small cap exposure” won’t reveal.
When Small Caps Win, When Mid Caps Win
The much-discussed “small-cap premium” is real over very long stretches, and it’s also easy to misread if you only look at the last few years.
Multi-decade U.S. data supports a historical return edge for small caps over large caps, but that edge is episodic rather than steady. There are entire decades where large caps dominate and small caps sit on the sidelines, followed by sharp reversals where small caps roar back. Investors who chase the premium after a strong run often buy in right before one of those multi-year lulls.
Small caps have beaten large caps across the full sweep of U.S. market history, but the path there includes stretches of years, sometimes a full decade, where the opposite is true.
Mid caps occupy a genuinely interesting middle ground. Some rolling-return analyses show mid-cap indexes producing attractive median returns across overlapping ten-year periods, in some stretches outperforming both their smaller and larger cousins. The logic makes sense: mid caps get enough of the growth upside from smaller companies while carrying more of the balance-sheet stability of larger ones.
A few macro conditions have historically tilted the field toward one tier or the other:
- Falling interest rates tend to help small caps more, since their financing costs make up a larger share of their overhead.
- Early-cycle economic recoveries have historically favored both small and mid caps, as domestically focused businesses benefit disproportionately from a reviving economy.
- Credit tightening or recession fears tend to punish small caps hardest first, since lenders pull back most aggressively from the riskiest borrowers.
- Sector concentration can distort any given period’s results. A small-cap index heavy in regional banks will behave very differently during a banking stress event than one that isn’t.
None of this means you can time these rotations reliably. It means the “which is better” question depends heavily on where you sit in the economic cycle when you ask it.
How to Choose Between Small-Cap and Mid-Cap Exposure
Once you understand the trade-offs, the actual decision comes down to time horizon, risk tolerance, and how much research capacity you’re willing to put in.
1. Set your allocation band before you pick anything. Many allocation frameworks suggest putting 10% to 25% of your equity sleeve into small- and mid-cap exposure combined, adjusted for your horizon and comfort with volatility. Investors with 15 plus years until they need the money can lean toward the higher end and toward small caps specifically. Investors within a decade of needing the money should lean toward mid caps or trim the combined allocation down.
2. Decide between funds and individual names early. A diversified small-cap or mid-cap ETF spreads out the single-company risk that makes this tier dangerous to concentrate in. Picking individual small-cap stocks demands real research time, since thin analyst coverage means you’re doing more of the diligence work yourself. Mid-cap stock-picking is somewhat more forgiving because coverage and disclosure tend to be better.
3. Run any individual small- or mid-cap name through a basic checklist. At minimum, check:
- Average daily trading volume high enough that you can exit without moving the price yourself.
- A balance sheet that isn’t overly dependent on short-term debt.
- Revenue that comes from more than one customer, product line, or region.
- A valuation that isn’t priced for a level of growth the company hasn’t actually demonstrated yet.
4. Watch for red flags specific to this size tier. Frequent share issuance to fund operations, a single customer accounting for a large share of revenue, or management teams with no analyst calls or transcripts available are all signs the risk is higher than the market cap alone suggests.
Pro Tip: Cap position sizes tighter in small caps than you would in large caps. A 2% to 3% max position size per small-cap name is a reasonable starting discipline, since a single bad earnings report can cut a thinly traded stock by 20% or more in a single session.
For a broader look at how to spread risk across a full portfolio, this asset allocation visualization tool is a useful resource for mapping out how a small- or mid-cap sleeve fits alongside your other holdings.
Trading Costs, Taxes, and Rebalancing in Practice
The gap between a small-cap fund’s advertised return and what you actually pocket often comes down to friction most investors never notice.
Liquidity drag is real and it’s invisible until you look for it. Wide bid-ask spreads on thinly traded small-cap stocks quietly erode returns every time you buy or sell. Using limit orders instead of market orders, and capping how much of a position you try to build or unwind in a single session, both help control this cost. Mid caps carry this drag too, just less severely.
Tax treatment doesn’t change based on market-cap tier. Capital gains rules apply the same way to a small-cap stock as they do to a mega-cap one: short-term gains (held under a year) get taxed as ordinary income, long-term gains get the preferential rate. What does change is your behavior. Small caps invite more active trading because of their volatility, and frequent trading raises your odds of triggering short-term rates and wash-sale complications if you sell at a loss and rebuy too soon.
Rebalancing matters more here than in large-cap holdings. A small-cap position that doubles can quietly become an oversized chunk of your portfolio, especially since these stocks move in bigger percentage swings. Practical habits worth adopting:
- Rebalance small- and mid-cap sleeves at least annually, or whenever a single position drifts more than a few percentage points from its target weight.
- Trim winners systematically rather than letting a single small-cap success story balloon into concentration risk.
- Reassess your fund’s underlying holdings periodically, since small-cap funds reclassify constituents more often than large-cap funds do.
How MarketCapLens Tracks Companies Moving Between Tiers
Watching a company drift from small-cap into mid-cap territory, or the reverse, tells you something real about how the market is repricing that business.
MarketCapLens tracks more than 2,500 publicly listed companies with data refreshed multiple times a day, alongside sector breakdowns and plain-English learn pages that walk through how the size tiers actually work. That update frequency matters specifically for this kind of research, since market-cap boundaries aren’t static. A stock sitting at $1.9 billion today can cross into mid-cap territory within weeks on a strong earnings run.
A few ways to put that tracking to work:
- Use the rankings pages to sort companies near the upper or lower bound of a tier, since those are the names most likely to get reclassified by index providers at the next rebalance.
- Check sector breakdowns to see whether a fund’s small-cap or mid-cap exposure is unusually concentrated in one industry.
- Revisit a stock’s classification periodically rather than assuming today’s label holds indefinitely.
Companies near that line often see outsized price moves around index rebalancing dates, since funds tracking that index have to buy or sell purely to match the new classification, regardless of the company’s fundamentals.*
A Disciplined Way to Think About Small vs. Mid Cap
The mistake most investors make with this decision isn’t picking the wrong tier. It’s treating the choice as permanent instead of conditional on where you are in a cycle and how long you have until you need the money.
My own framework is simple: diversify across names within whichever tier you choose, keep individual position sizes small enough that one bad quarter doesn’t wreck your year, and pay attention to credit conditions and rate direction more than headlines about “the next hot small-cap stock.” Time horizon does more work than conviction here. An investor with fifteen years to go can absorb small-cap volatility that would be reckless for someone five years from retirement.
Use the screening checklist and allocation bands above as your actual decision tools, not the latest market narrative. The companies crossing tier boundaries right now, visible on any market-cap ranking page, are a better signal of where the market’s attention is heading than any single headline will ever be.
— MarketCapLens
Track Small- and Mid-Cap Movements With MarketCapLens
Once you’ve settled on an allocation band, the harder part is watching which specific companies are actually shifting between tiers. Some platforms refresh data on thousands of companies multiple times daily, with sector breakdowns that show where small- and mid-cap exposure is concentrated before you commit capital.

Instead of relying on a fund provider’s quarterly reclassification, you can check current market-cap rankings any day of the week and see which names are drifting toward a new tier in real time. If you’re still nailing down the fundamentals, the plain-English guide to market capitalization breaks down exactly how the number is calculated and why it moves. Start by pulling up the rankings page and filtering for companies sitting near a size threshold. That’s usually where the most interesting stories are happening.
Sources
The dollar-range definitions and index mechanics in this article draw on the following sources:
- Large-Cap vs. Mid-Cap vs. Small-Cap Stocks: The Historical Return Differences and Risk Tradeoffs
- Why market cap matters - Fidelity
This article is general information, not a substitute for advice from a qualified financial advisor. Consult a qualified financial professional about your own circumstances before acting on anything here.
FAQ
Which Is Better, Small-Cap or Mid-Cap?
Neither is universally better; it depends on your time horizon and risk tolerance. Small caps have historically delivered a return premium over very long stretches but with sharper volatility and drawdowns, while mid caps offer a middle ground with somewhat steadier price behavior and better analyst coverage.
Will Small Caps Do Well in 2026?
No source can predict a single year’s performance with certainty, and small-cap returns depend heavily on interest rate direction and credit conditions. Historically, falling rates and early-cycle recoveries have tended to favor small caps, while credit tightening has hit them hardest first.
Does Warren Buffett Invest in Small Caps?
Berkshire Hathaway’s public portfolio is overwhelmingly concentrated in large- and mega-cap companies, reflecting the fact that a portfolio of Berkshire’s size can’t meaningfully deploy capital into small, thinly traded names without moving the price against itself. That’s a liquidity constraint tied to scale, not a verdict on small caps as an asset class.
Is the S&P 500 a Large-Cap or Small-Cap Index?
The S&P 500 is a large-cap index, tracking the largest U.S. public companies by market value. Investors looking for small-cap or mid-cap exposure instead typically use the Russell 2000 or the S&P MidCap 400.
What Counts as a Mid-Cap Stock?
A mid-cap stock generally falls between roughly $2 billion and $10 billion in market capitalization, though the exact cutoffs shift slightly depending on the index provider. You can check where any individual company currently ranks using MarketCapLens’s live rankings.
Recommended
For informational purposes only and is not investment advice. Do not rely on the facts, figures, ticker symbols, or other statements in this article — they may be incomplete, outdated, or incorrect, and we are not responsible for errors. See our disclaimer.