SPY vs VOO: Which S&P 500 ETF Should You Buy?
By MarketCapLens · Published · 10 min read
For most people who buy and hold, VOO is the better fit, because it charges a 0.03% expense ratio against 0.0945% for SPY and follows the same index. SPY earns its place with traders and institutions who move large sums, because it has far heavier daily trading volume and tighter bid-ask spreads. Both funds hold essentially the same 500-odd U.S. large-cap stocks, so the choice comes down to cost and how you trade.
MarketcaplensSee the Companies Behind the IndexCompare market trends, historical data, share prices, and sector allocations across thousands of public companies with MarketCapLens.Explore company dataTL;DR
- Both ETFs aim to match the S&P 500, so their holdings and returns are nearly identical.
- VOO’s expense ratio is 0.03%. SPY’s gross expense ratio is 0.0945%, about $6.45 more per year on every $10,000 invested.
- SPY trades far more volume and has a tighter average spread, which matters for frequent or very large trades.
- Long-term buy-and-hold investors usually benefit most from VOO’s lower cost. Active traders may prefer SPY’s liquidity.
- Owning both adds almost no diversification, because they overlap nearly completely.
Table of Contents
- What SPY and VOO actually are
- SPY vs VOO at a glance
- Expense ratio: the one difference you can count on
- Performance: why the returns look the same
- What is inside: the same stocks in the same weights
- Liquidity and trading costs
- Which one should you pick?
- Should you own SPY and VOO together?
- Our perspective
- See what your ETF really holds
- FAQ
- Sources
What SPY and VOO actually are
The S&P 500 is an index, a list of large U.S. companies weighted by size. You cannot buy an index directly. You buy an exchange-traded fund (ETF) that tries to copy it, and SPY and VOO are two such funds.
State Street’s issuer page describes SPY as a fund that seeks results corresponding generally to the S&P 500 Index before expenses. The index is float-adjusted and market-capitalization-weighted, and it covers the large-cap U.S. market.
Vanguard’s profile says VOO seeks to track the S&P 500 Index with a passively managed, full-replication strategy. That means it holds the index’s stocks directly. It is an exchange-traded share class of the Vanguard 500 Index Fund and launched on September 7, 2010.
So the two funds do the same job. The remaining differences are cost, trading characteristics and a few reporting details.
SPY vs VOO at a glance
| Feature | SPY | VOO |
|---|---|---|
| Issuer | State Street | Vanguard |
| Index tracked | S&P 500 | S&P 500 |
| Expense ratio | 0.0945% (gross) | 0.03% |
| Number of holdings | 504 (September 30, 2026) | 505 (September 30, 2026) |
| Dividend yield | 1.10% (index) | 1.1% |
| Average daily trading volume, 12-month notional | $44.73 billion | $4.40 billion |
| Average bid-ask spread | 0.27 basis points | 0.59 basis points |
The expense ratios come from State Street’s SPY page and Vanguard’s VOO profile. The holdings count and yield for SPY are in its September 2026 fact sheet. Trading volume and spreads are from State Street’s SPY brochure, as of December 31, 2025, and the brochure is an issuer document, so it is State Street’s own comparison.
Expense ratio: the one difference you can count on
The expense ratio is the annual fee, taken out of the fund’s assets. You never get a bill. It simply reduces your return a little each year.
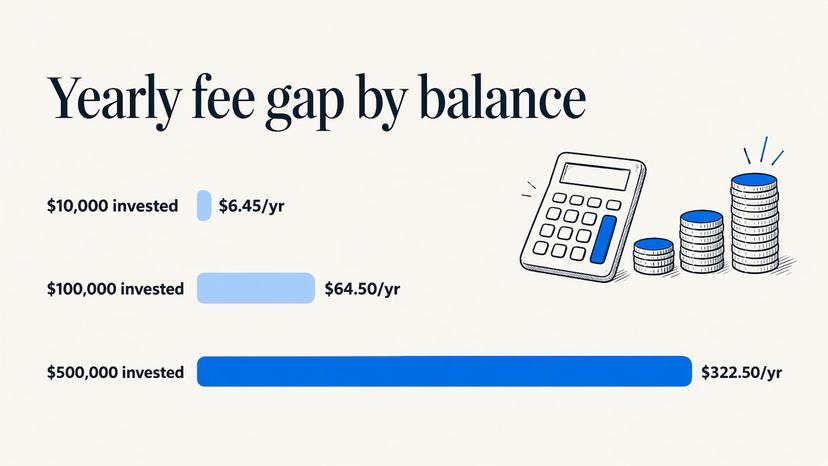
SPY’s gross expense ratio is 0.0945%, according to State Street, as of November 8, 2026. VOO’s is 0.03%, as of April 2026. The gap is 0.0645 percentage points, or roughly 6.5 basis points.
Here is what that looks like in dollars, using simple arithmetic on those two rates:
| Amount invested | Yearly fee on SPY | Yearly fee on VOO | Difference |
|---|---|---|---|
| $10,000 | $9.45 | $3.00 | $6.45 |
| $100,000 | $94.50 | $30.00 | $64.50 |
| $500,000 | $472.50 | $150.00 | $322.50 |
These figures hold the balance constant, so they understate the effect if your portfolio grows. The money you save also stays invested and compounds. On a small account the gap is a cup of coffee. On a large account held for decades it adds up, which is why buy-and-hold investors lean toward VOO.
Performance: why the returns look the same
Because both funds follow the same index, their returns before fees are nearly identical. What separates them is the fee and small tracking differences.
Vanguard’s September 30, 2026 fact sheet shows how closely a fund like VOO follows the index. These are VOO’s NAV total returns next to the S&P 500 Index:
| Period | VOO (NAV) | S&P 500 Index |
|---|---|---|
| Year to date | 2.30% | 2.30% |
| 1 year | 12.72% | 12.75% |
| 3 years (annualized) | 15.70% | 15.74% |
| 5 years | 22.85% | 22.89% |
| 10 years | 13.75% | 13.79% |
| Since inception | 15.29% | 15.33% |
The gap is about 0.03 to 0.04 percentage points in every period beyond year to date, which is close to the fund’s fee. Expect SPY’s total return to land in the same neighborhood, a touch lower once its higher fee is counted. Past returns never promise future results, and both funds will rise and fall with the large-cap U.S. market.
So a search for “SPY vs VOO performance” mostly returns one answer: the same index, the same stocks, and a small fee-driven edge for the cheaper fund.
What is inside: the same stocks in the same weights
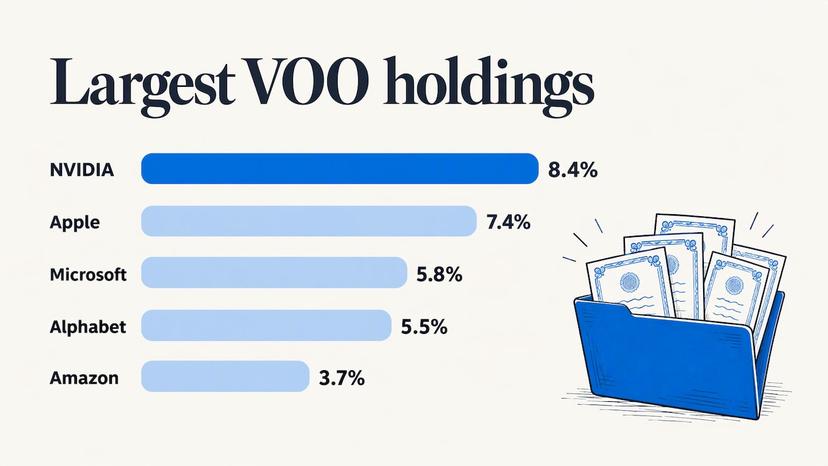
Since both follow the S&P 500, both are top-heavy. Vanguard’s September 30, 2026 holdings table puts NVIDIA at 8.4%, Apple at 7.4%, Microsoft at 5.8%, Alphabet at 5.5% and Amazon at 3.7% of VOO. The top ten holdings together make up 40.6% of net assets. SPY, tracking the same index, carries the same names at nearly the same weights.
That has a practical meaning. Buying either fund is not a bet on 500 equal companies. It is a bet weighted heavily toward a handful of megacap technology and AI-linked names. If you want to watch that concentration over time, our guide on S&P 500 top-10 concentration and AI megacaps shows how to monitor it, and the piece on the S&P 500 tech sector weight explains the sector side of the same story.
One small wrinkle: the funds report slightly different holdings counts (505 for VOO and 504 for SPY on September 30, 2026) and use different valuation labels. Vanguard lists a price/earnings ratio of 24.7x for VOO, while State Street lists a FY1 price/earnings ratio of 20.38 for SPY. Those numbers come from different calculation bases, so do not read them as one fund being cheaper than the other. They hold the same index.
Liquidity and trading costs
This is where SPY justifies its higher fee for some investors. State Street’s brochure reports 12-month average daily notional trading volume of $44.73 billion for SPY, $4.45 billion for IVV and $4.40 billion for VOO. It also reports average bid-ask spreads of 0.27 basis points for SPY, 0.64 for IVV and 0.59 for VOO, as of December 31, 2025.
In plain terms, SPY trades about ten times the dollar volume of VOO, and its spread, the gap between the buying and selling price, is narrower. On a $100,000 trade, the average spread works out to roughly $2.70 for SPY and $5.90 for VOO. That is a tiny cost per trade, and still far smaller than most investors’ other costs.
Who notices the difference?
- Frequent traders and large institutions. If you move big blocks or trade in and out often, SPY’s depth and spreads can matter more than the annual fee.
- Options users. State Street’s issuer data points to heavier options activity and trading volume in SPY.
- Long-term holders. If you buy a few times a year and hold, the extra spread cost of VOO is paid only when you trade, while SPY’s higher fee is paid every year.
Fund size is not a worry for either one. Vanguard reports VOO ETF total net assets of about $1.03 trillion as of September 30, 2026, and State Street reports $711.8 billion in assets under management for SPY as of December 31, 2025. Both are among the largest ETFs in the world, so closure risk is not a practical concern for either.
Which one should you pick?
Use your holding period and trading habits as the test.
- You invest monthly and hold for years. Choose VOO. The lower expense ratio is a guaranteed saving, and the spread difference barely touches you.
- You trade often or in large size. SPY’s volume and spread may serve you better, and the fee is a smaller part of your total cost.
- You use options or short-term strategies. SPY’s options activity is a reason to consider it.
- You are choosing for a retirement or long-term account. VOO’s cost advantage compounds over decades, so it is the usual default.
- You already own one. Check whether switching triggers a taxable gain in a regular brokerage account before you swap. Tax rules depend on your situation, so ask a tax professional if the amount is large.
If you simply want one S&P 500 fund and never plan to trade it often, VOO is the simpler answer. Neither choice is a mistake, since the underlying exposure is the same.
Should you own SPY and VOO together?
There is little reason to. Holding both gives you the same 500 companies twice, with no extra diversification and a slightly higher blended fee than VOO alone. Some traders keep SPY for short-term trades and VOO for long-term holdings, and that is a defensible split. For a plain long-term portfolio, one fund is enough.
If you want real diversification, look beyond a single large-cap index. A global fund adds non-U.S. stocks, as our comparison of VT and VTI shows. Some investors also add an uncorrelated sleeve, and an example of that thinking is gold copy trading diversification, which looks at how small allocations to a different asset behave. Whatever you add, size it to your own goals and risk tolerance.
Our perspective
Choosing between two near-identical funds is a good reminder that the index matters more than the wrapper. Both SPY and VOO hand you the same market-cap-weighted exposure, and market cap is exactly what decides how much of your money goes to each company.
That is why we track more than a ticker. When Nvidia, Apple and Microsoft grow, they take a bigger share of every S&P 500 fund automatically. We built MarketCapLens so you can see those shifts across more than 2,500 companies, with data refreshed multiple times a day, and judge what your fund really owns.
Our advice is to settle the fee and liquidity question once, then spend your attention on what is inside: the top-10 weight, the sector mix and the megacap names. That is where the real risk and return of an S&P 500 fund come from.
MarketCapLens
See what your ETF really holds
Once you pick a fund, look at the companies behind it. MarketCapLens ranks public companies by market capitalization, with sector breakdowns and daily and historical performance, so you can see how much of the S&P 500 sits in a few giants.
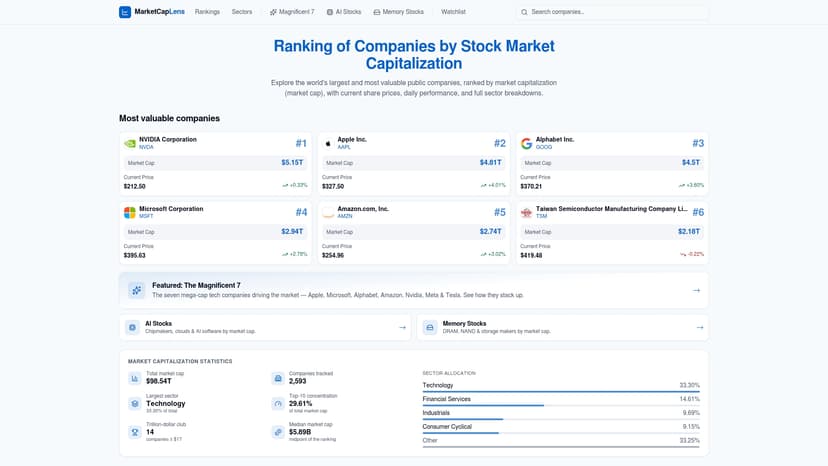
Start with the market cap rankings, then browse sectors ranked by market cap or our featured Magnificent 7 and AI stocks. To check a company’s size yourself, use the market cap calculator.
FAQ
What is the expense ratio of VOO compared to SPY?
VOO’s expense ratio is 0.03%, as of April 2026, according to Vanguard. SPY’s gross expense ratio is 0.0945% as of November 8, 2026, according to State Street. On $10,000 that is $3.00 against $9.45 a year.
Is VOO better than SPY?
For long-term investors, usually yes, because it tracks the same index at a lower cost. SPY can be the better tool for active traders who value its higher trading volume and narrower spread. Neither is wrong for a simple S&P 500 holding.
Is the Vanguard S&P 500 ETF the same as the S&P 500?
No. The S&P 500 is an index, not something you can buy. VOO is a fund that aims to track it by holding its stocks. Small differences from fees and timing mean its return runs a few hundredths of a percentage point below the index, as the Vanguard fact sheet shows.
Should I buy VOO and SPY at the same time?
There is little benefit, since both hold essentially the same companies in the same weights. You would double up on the same exposure and pay a higher blended fee than with VOO alone. If you want more diversification, add a different type of fund, such as a global or sector ETF, rather than a second S&P 500 fund.
Sources
- SPY: State Street SPDR S&P 500 ETF Trust
- Vanguard S&P 500 ETF investment profile
- Vanguard S&P 500 ETF fact sheet, September 30, 2026
- State Street SPDR S&P 500 ETF Trust brochure
- State Street SPDR S&P 500 ETF Trust fact sheet, September 2026
- Gold copy trading for diversification
Recommended
For informational purposes only and is not investment advice. Do not rely on the facts, figures, ticker symbols, or other statements in this article — they may be incomplete, outdated, or incorrect, and we are not responsible for errors. See our disclaimer.