Trillion Dollar Companies: Who Is in the Club and How to Track It
By MarketCapLens · Published · 11 min read
A trillion-dollar company is a publicly traded business whose market capitalization, the share price multiplied by the shares outstanding, is $1 trillion or more. Roughly sixteen companies worldwide qualified in the autumn of 2026, led by Nvidia, Apple, Alphabet, Microsoft and Amazon, and the membership changes whenever share prices move. A static list goes stale in days, so the useful skill is knowing how the number is built, where each company sits and how to check a live ranking.
Marketcaplensmarketcaplens.comTrack the Trillion-Dollar ClubSee market-cap rankings, share prices, sector breakdowns and historical data for thousands of public companies.VisitTL;DR
- A “trillion-dollar company” means a public company with a market cap of $1 trillion or more. Private firms are not counted.
- At the close on 25 September 2026, the five largest were Nvidia, Apple, Alphabet, Microsoft and Amazon. Nvidia was the first company ever to pass $5 trillion.
- Market cap is a perceived value set by investors, not net worth, and it changes every trading day.
- Membership turns over: Micron joined in May 2026, and a dozen U.S. companies have now closed above $1 trillion at least once.
- Check a live, sortable ranking before relying on any article’s table, including this one.
Table of Contents
- What counts as a trillion-dollar company
- The trillion-dollar list, ranked by market cap
- How much bigger is the club than a “mega-cap”
- Why the list keeps changing
- Where trillion-dollar companies are based
- How to read a trillion-dollar ranking as an investor
- A worked example: tracking the $1 trillion line
- Promo: follow the ranking live
- Our view
- FAQ
- Sources
What counts as a trillion-dollar company
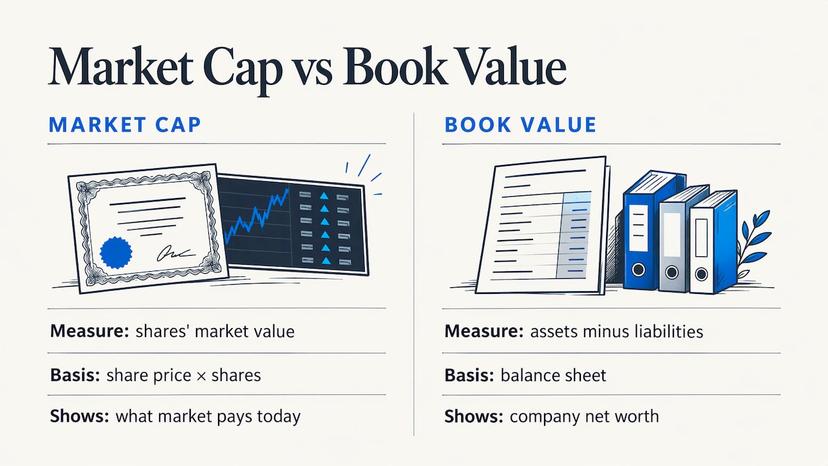
The label rests on one measure: market capitalization. FINRA, the U.S. securities industry regulator, defines it as the total value of a company’s outstanding shares, including restricted shares held by officers and insiders, found by multiplying total shares outstanding by the current stock price.
A quick example: a company with 15 billion shares outstanding trading at $200 has a market cap of $3 trillion. If the price rises 10% to $220, the market cap becomes $3.3 trillion, an increase of $300 billion in one move. That is why the biggest companies can add or lose the value of an entire mid-sized business in a single session.
Three boundaries keep the term precise:
- Public companies only. A privately held firm can be valued in a funding round, but it has no continuously traded share price, so it does not appear in market cap rankings.
- Equity value, not total value. Market cap measures what the market assigns to the shares. Debt and cash are not included, which is why analysts also look at enterprise value (market cap plus debt, minus cash).
- A price at a moment. The figure is quoted at a close or intraday, so two tables dated a day apart can disagree without either being wrong.
Market cap is not net worth
This is the most common confusion in the search results. FINRA describes market cap as a perceived value: the share price is set by investors, and part of it may reflect expectations of future growth. If those expectations do not pan out, the share price, and so the market cap, adjusts accordingly.
Net worth, or book value, comes from the balance sheet: assets minus liabilities. A company can trade at many times its book value when investors expect strong growth. Market cap tells you what the market is paying for the business today. It does not tell you what the company would fetch if sold, or what it owns.
The same logic answers a question readers often type: “Who is richer, Amazon or Apple?” By market cap, the one with the larger figure on a given day. By revenue, assets or profit, the answer can differ, and each measure answers a different question.
The trillion-dollar list, ranked by market cap
The table below shows approximate market caps from a published September 2026 list, with the year each company first crossed $1 trillion. Treat the dollar figures as a snapshot: they were recorded around the 25 September 2026 close, and every one of them has moved since. The ranking order is the more durable part.
| Rank | Company | Ticker | Approx. market cap | First crossed $1T |
|---|---|---|---|---|
| 1 | Nvidia | NVDA | $5.4 trillion | June 2023 |
| 2 | Apple | AAPL | $5.0 trillion | August 2018 |
| 3 | Alphabet | GOOGL | $4.2 trillion | January 2020 |
| 4 | Microsoft | MSFT | $3.8 trillion | April 2019 |
| 5 | Amazon | AMZN | $2.7 trillion | February 2020 |
| 6 | TSMC | TSM | $2.3 trillion | July 2025 |
| 7 | Meta Platforms | META | $1.9 trillion | June 2021 |
| 8 | Broadcom | AVGO | $1.7 trillion | December 2024 |
| 9 | Tesla | TSLA | $1.5 trillion | October 2021 |
| 10 | Micron Technology | MU | $1.2 trillion | May 2026 |
| 11 | Berkshire Hathaway | BRK.B | $1.1 trillion | August 2024 |
| 12 | Eli Lilly | LLY | $1.1 trillion | November 2025 |
Source for the table: a September 2026 list of trillion-dollar companies. The same list also includes non-U.S. listings such as Saudi Aramco and Samsung, which I left out of the table to keep it to U.S.-listed names. Figures are rounded to one decimal.
How the club splits by size
On that same list, six companies were above $2 trillion, four above $3 trillion and three above $4 trillion. Those are the “multi-trillion-dollar companies” people search for. The gap between the top and the bottom is large: Nvidia’s figure is more than four times that of a company sitting just above the $1 trillion line.
Has any company reached a $4 trillion market cap?
Yes, several have. The milestone that drew the most attention was Nvidia’s. Reuters reported on 29 October 2025 that it became the first company to pass $5 trillion in market value, only about three months after it hit $4 trillion. As of the September 2026 list above, three companies were above $4 trillion.
How much bigger is the club than a “mega-cap”
FINRA’s size bands show how extreme the trillion-dollar tier is. Mega-cap starts at $200 billion, large-cap runs from $10 billion to $200 billion, mid-cap from $2 billion to $10 billion, small-cap from $250 million to $2 billion, and micro-cap is anything under $250 million.
So a $1 trillion company is five times the lower bound of mega-cap. A company at the $5 trillion level is 25 times that threshold. When you read about a “mega-cap” stock, the label covers a very wide range, and the top few names behave differently from the rest because index funds hold them in large weights.
For students, that is worth remembering when you read sector or index data: a handful of companies can account for a large share of an index’s movement. Looking at sector breakdowns shows how concentrated the weight is. Our technology sector ranking is a good place to see how much of the sector’s value sits in the largest few names, and the financial services and healthcare pages show the same effect in their own sectors.
Why the list keeps changing
Membership in the club is not permanent. A 10% fall in a share price takes $300 billion off a $3 trillion company, and for a company near the line it can push it out. A rally does the opposite.
The rise of semiconductor and AI-linked names shows how quickly it can happen. Nasdaq Dorsey Wright reported that Micron joined the $1 trillion club as of May 22, 2026, becoming the 12th U.S. company to have ever closed above $1 trillion, with its shares up more than 210% in 2026. The same analysts observe that assets in extreme runs are often good at getting even more overbought, a reminder that momentum can carry values a long way in either direction.
If you want the company-level view, our Micron Technology page shows its market cap and stock price, and our semiconductor equipment stocks ranking shows how the wider chip supply chain is valued.
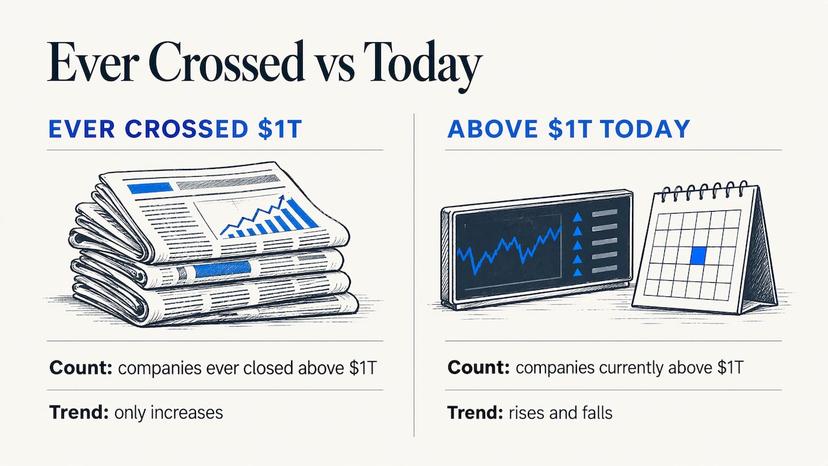
Note the wording “ever closed above.” It matters because a company can join the list, drop below $1 trillion and return later. The count of companies that have ever crossed the line only goes up; the count of companies above it today goes up and down.
What moves a market cap
Three things change the number:
- Share price. This is the daily driver: earnings reports, interest rate expectations, product news and general market mood all move it.
- Shares outstanding. Buybacks reduce the share count, and issuing new stock or paying staff in shares increases it. These shifts are slow compared with price swings.
- Which share classes are counted. Alphabet has multiple share classes, for example, so a ranking has to decide how to combine them. Different sites can show slightly different totals for the same company because of this.
That last point explains many small mismatches between rankings. If two sources differ by a few percent, check the timestamp and the share-class method before assuming one is wrong.
Where trillion-dollar companies are based
The club is heavily American. A widely cited chart-based ranking noted that the United States has far more members than any other country, followed by China and Saudi Arabia. Within the U.S., the technology sector dominates, but the list also includes a conglomerate holding insurance and railroads (Berkshire Hathaway) and a pharmaceutical maker (Eli Lilly).
That location matters for investors who compare companies across borders, because tax regimes shape reported profits. If you want to see how headline corporate tax rates differ internationally, this comparison of countries with the highest corporate tax gives a country-by-country view that helps put a trillion-dollar company’s home jurisdiction in context.
How to read a trillion-dollar ranking as an investor
A ranking is a starting point. Here is how to use one without being misled.
Check the date and the time
The first question for any table is when the prices were recorded. A figure from a close on one date and a figure from intraday trading on another are not comparable. Write the date next to any number you copy into a model or a paper.
Separate size from quality
Market cap tells you how big the market’s valuation is. It says nothing about profitability, debt or whether the price is justified. Two companies with the same $1.5 trillion value can have very different earnings and growth. To go beyond size, use valuation tools. Our enterprise value calculator adds debt and cash to the equity figure, and our DCF calculator estimates intrinsic value per share from your own cash flow assumptions.
Compare within a sector
A trillion-dollar chipmaker and a trillion-dollar insurer are valued on different logic. Compare each with its sector peers before drawing conclusions. The sectors overview lets you move between technology, financial services, industrials, energy and others, so you can see where a giant sits among its peers.
Watch the concentration
When a few companies make up a large slice of the total, a swing in one of them can move an entire index. Our featured page on the Magnificent 7, AI and memory stocks groups several of the largest names so you can follow them together.
A worked example: tracking the $1 trillion line
Suppose you want to know which companies are close to entering the club. Here is a routine that takes about ten minutes.
- Open a ranking sorted by market cap and note the companies between roughly $700 billion and $1 trillion.
- For each, calculate the price rise needed to reach $1 trillion: divide $1 trillion by the current market cap and subtract one. A company at $800 billion needs a 25% rise. One at $950 billion needs about 5.3%.
- Compare that with the stock’s recent volatility and earnings calendar. A company that moved 25% in a quarter is a plausible candidate; one that rarely moves 5% in a month is not.
- Revisit weekly. The order can change quickly, especially in sectors with fast earnings revisions.
This kind of arithmetic is why the $1 trillion line is a milestone rather than a category: companies drift across it in both directions.
Promo: follow the ranking live
The MarketCapLens ranking covers more than 2,500 public companies, with share prices and sector breakdowns that update multiple times a day. You can see the trillion-dollar companies at the top, then scroll down to the next tier and watch who is closing the gap.
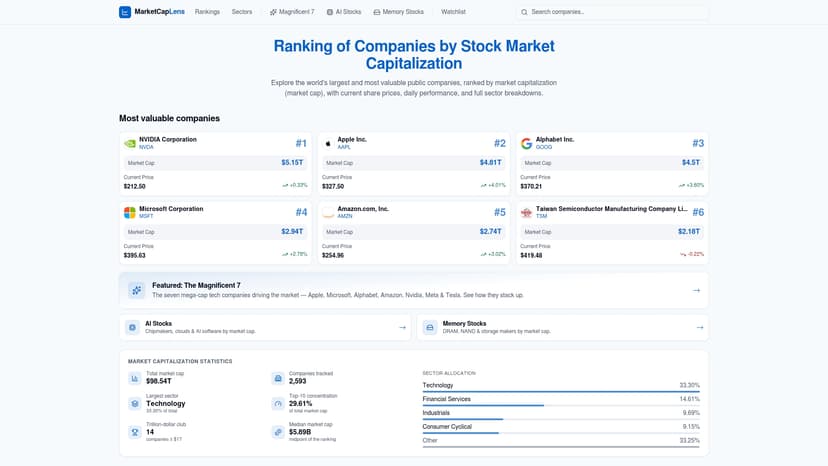
If you want to know how the list is put together, how the ranking works explains it in plain English. For size, value and returns arithmetic, our stock calculators are in one place.
Our view
A trillion-dollar label is a headline, and headlines hide the structure underneath. The questions that help an investor are which sector the value sits in, how far the next company is from the line, and how the figure was timed.
That is why we built MarketCapLens as a lens, not a list. We track more than 2,500 companies, refresh the data multiple times a day, and break each ranking down by sector so that a student, an analyst or an individual investor can move from “who is biggest” to “why, and compared with whom.”
We also write in plain English. Market cap, enterprise value and intrinsic value are simple ideas once each is explained in a sentence, and everyone researching the market should be able to use them without a finance degree.
MarketCapLens
FAQ
How many companies are worth $1 trillion?
It depends on the day. A September 2026 list counted about sixteen worldwide, with twelve U.S. companies to have ever closed above $1 trillion as of May 2026 according to Nasdaq Dorsey Wright. Because prices move, the number above the line on any given day can differ from the number that have ever crossed it. Use a live ranking for today’s count.
Is market cap the same as net worth?
No. Market cap is the share price multiplied by shares outstanding, and FINRA describes it as a perceived value set by investors. Net worth, or book value, is assets minus liabilities from the balance sheet. A company can have a market cap far above or below its book value.
Has any company hit a $4 trillion market cap?
Yes. Nvidia passed $4 trillion in mid-2025 and became the first company to pass $5 trillion in October 2025, according to Reuters reporting. By a September 2026 list, three companies were above $4 trillion. Those figures move with each trading day.
Which companies have the largest market caps?
At the 25 September 2026 close, the top five were Nvidia, Apple, Alphabet, Microsoft and Amazon. Rankings can swap places when the gap is small, so check the date on any list you use.
Sources
- Market Cap Explained, FINRA
- Micron Hits 1 Trillion: A Historical Guide to Joining the $1T Club, Nasdaq Dorsey Wright
- Trillion-Dollar Companies: The Full 2026 List
- Chipmaker Nvidia hits $5 trillion valuation, Al Jazeera
Recommended
For informational purposes only and is not investment advice. Do not rely on the facts, figures, ticker symbols, or other statements in this article — they may be incomplete, outdated, or incorrect, and we are not responsible for errors. See our disclaimer.