VT vs VTI: Global or U.S.-Only Stock ETF?
By MarketCapLens · Published · 9 min read
VT and VTI are both low-cost Vanguard ETFs that buy the whole stock market, but they define “the market” differently. VTI owns only U.S. companies. VT owns companies in the U.S. and around the world, weighted by size. If you want a single fund that covers every public market, VT does that. If you want to bet on American companies and add international stocks yourself (or skip them), VTI is the cleaner tool. The rest of this guide shows the numbers behind that choice.
MarketcaplensCompare Markets Beyond One FundExplore market capitalization, sector breakdowns, historic data, and daily performance metrics for thousands of public companies worldwide.Explore company dataTL;DR
- VTI tracks the U.S. stock market only: large-, mid- and small-cap companies, with an expense ratio of 0.03%.
- VT tracks stocks worldwide, U.S. and international, with an expense ratio of 0.06%.
- Over the last ten years the U.S.-only fund came out ahead (243.92% vs 230.52%). Over the last twelve months, as of mid-2026, the global fund led (23.59% vs 21.5%).
- Both are market-cap weighted, so the biggest U.S. tech names matter in both, just much more in VTI.
- Choose VT for one-fund global simplicity. Choose VTI if you want a U.S. core you can pair with your own international allocation.
Table of Contents
- What VTI and VT actually hold
- VT vs VTI side by side
- Cost: 0.03% vs 0.06%
- Performance: why the time window decides the winner
- Diversification and concentration
- Which one fits you?
- Taxes and account placement
- Check your own exposure with live data
- A simple way to decide
- FAQ
- Sources
What VTI and VT actually hold
VTI: the entire U.S. stock market
VTI is the Vanguard Total Stock Market ETF. According to Vanguard’s fact sheet, it seeks to track a broad U.S. total market index and holds large-, mid- and small-cap stocks. As of September 30, 2026, it held 3,519 stocks and charged a 0.03% expense ratio. Its top ten holdings made up 36.1% of net assets, led by NVIDIA (7.1%), Apple (6.6%) and Microsoft (5.2%).
That last number matters. Even a fund with thousands of stocks can be top-heavy when it weights by market capitalization. Roughly a third of VTI sits in ten companies.
VT: every public market in one fund
VT is the Vanguard Total World Stock ETF. Vanguard’s product page says it seeks to track the FTSE Global All Cap Index, a free-float-adjusted, market-cap-weighted index covering large-, mid- and small-cap stocks. As of September 30, 2026, it held 10,185 stocks, about 90% of them in developed markets and about 10% in emerging markets.
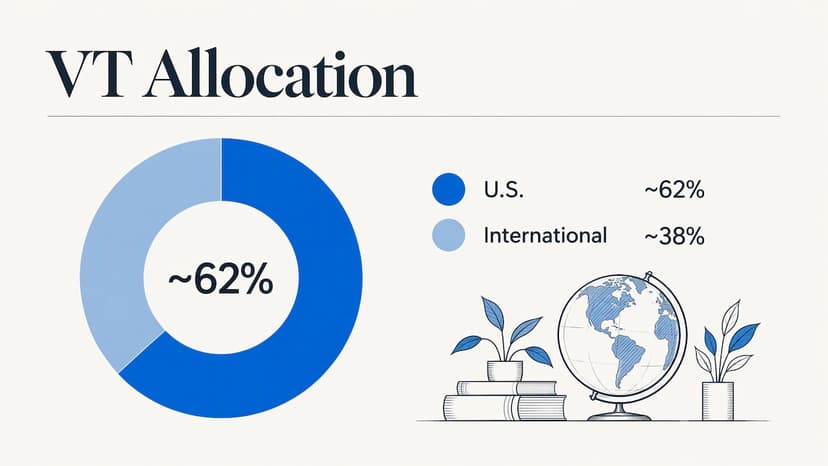
Because VT weights each country by the combined value of its listed companies, nobody picks the U.S. share. It floats. One long-time index-fund author reported in February 2026 that the split was around 62% U.S. and 38% international, and that it will keep shifting as relative market values move. So VT is still majority American. It is just not entirely American.
The practical consequence: VT’s top holdings look familiar (the same large U.S. technology names), but each carries a smaller weight than in VTI because they share the fund with companies from Europe, Japan, Canada, emerging Asia and elsewhere.
VT vs VTI side by side
| VTI | VT | |
|---|---|---|
| Coverage | U.S. stocks only | U.S. and international stocks |
| Number of stocks (Sept. 30, 2026) | 3,519 | 10,185 |
| Expense ratio | 0.03% | 0.06% |
| Weighting | Market cap | Market cap (free-float adjusted) |
| Currency exposure | U.S. dollar | Dollar plus foreign currencies |
| 10-year return (as of mid-2026) | 243.92% | 230.52% |
| 12-month return (as of mid-2026) | 21.5% | 23.59% |
| Role in a portfolio | U.S. core | Whole-market, one-fund core |
Figures come from the Vanguard pages above and the 24/7 Wall St. comparison, published July 3, 2026. Return figures are point-in-time snapshots and will have moved since.
Cost: 0.03% vs 0.06%
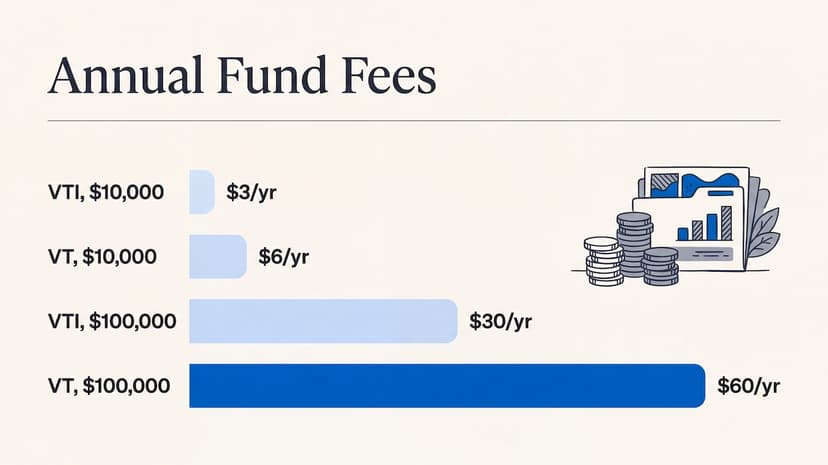
VT’s expense ratio is 0.06%, double VTI’s 0.03%. Doubling sounds dramatic, but the dollars are small. On a $10,000 holding, VTI costs about $3 a year in fund fees and VT about $6. On $100,000, it is $30 against $60.
That extra cost pays for holding thousands of foreign shares across dozens of countries, which is more expensive to trade and custody than U.S. stocks. If you would otherwise buy a separate international fund to pair with VTI, check that fund’s fee too. The blended cost of a two-fund mix often lands near VT’s 0.06%. We cover that comparison in our look at ACWI and all-world ETF costs.
Dividends are a similar story. VT’s dividend yield was 1.55% as of September 30, 2026. Check VTI’s current yield on Vanguard’s page before comparing, since yields move with prices and payouts. Either way, a total-market stock fund is a growth-and-dividend blend, not an income product, and dividends are taxable in a regular brokerage account in the year you receive them.
Performance: why the time window decides the winner
Searching for VT vs VTI performance gives different answers on different days, because the winner depends on when you start counting.
According to the 24/7 Wall St. analysis, VT returned 230.52% over ten years against 243.92% for VTI. That is a gap of 13.4 percentage points in the U.S. fund’s favor. Over the previous twelve months, the order flipped: VT returned 23.59% against 21.5%, about two points ahead.
Three takeaways:
- The last decade favored U.S. stocks. American technology and large-cap growth led global markets, and VTI captured more of it.
- Leadership rotates. The same analysis cites Franklin Templeton’s observation that U.S. equities carry a 34% valuation premium over international stocks, versus a long-run average of 19%. A wide premium does not predict the next year, but it shows the two markets are priced differently.
- Ten years is not a forecast. A fund that led in one window can trail in the next. Picking a fund because it won the last decade is picking the past.
A useful habit: when you read any comparison, note the start date. Returns that begin at a market low or high say more about the date than about the fund.
Diversification and concentration
VTI has 3,519 holdings, VT has 10,185, and on paper VT is more diversified. But diversification is about where your money actually sits, not the count of tickers.
Because both funds weight by size, a handful of giants set the tone. In VTI, ten stocks are 36.1% of assets. In VT, those same companies are diluted by foreign markets, so concentration is lower, though still tilted to U.S. mega-caps. If you want to see how this works, our explainer on market cap weighting walks through the logic and a four-step check, and our US vs global market cap page puts the U.S. share of world equity value in context.
What VT adds that VTI cannot:
- Exposure to economies and sectors that are small in the U.S., such as banks, industrials, energy and consumer brands abroad.
- Foreign currency exposure, which can cushion or amplify moves depending on the dollar.
- Protection against the case where the U.S. market lags for a long stretch.
What VTI adds that VT cannot:
- A purer bet on U.S. corporate earnings.
- Lower fees.
- Full control. You pick your own international allocation, whether 0%, 20% or 40%.
Which one fits you?
The 24/7 Wall St. piece frames the decision well: VT’s implicit thesis is humility (no one knows which country wins next, so own them all in proportion), while VTI’s is that American earnings, dollar strength and the AI investment cycle keep compounding faster than anywhere else. Neither is wrong. They are different views on the future.
VT may suit you if:
- You want one fund for all your stocks and nothing to rebalance.
- You do not want to decide how much to hold abroad.
- You are early in investing and want a hands-off default.
VTI may suit you if:
- You already own international funds, or want to set that allocation yourself.
- You want the lowest possible expense ratio.
- Your employer plan or other accounts already hold international exposure, and VTI fills the U.S. slot.
Can you own both? Yes, but they overlap heavily. VT already contains the U.S. market. Holding both just raises your U.S. weighting, which you can do more simply by choosing a different split in the first place.
If you go the two-fund route, remember that the mix drifts as one side outruns the other. Our guide to portfolio rebalancing and target weights explains how to set bands and when to adjust. VT does that drifting for you inside the fund, which is its main convenience.
Taxes and account placement
In the U.S., foreign taxes withheld on international dividends can generally be claimed as a credit when a fund is held in a taxable account, which is one reason some investors keep global funds in taxable accounts and others do not care. The details depend on your situation, so confirm with a tax professional or the IRS guidance for your filing. In an IRA or 401(k), the question mostly disappears, and the choice comes down to the allocation and fee points above.
Perspective
We look at markets through market capitalization every day, and one thing shows up again and again: the share of world equity value that any one country holds is not fixed. Cap-weighted funds like VT quietly follow that share wherever it goes, while VTI takes a position on one market. Neither choice is a mistake, but it should be a choice rather than an accident.
Our approach is to look at the actual weights. Check how much of your portfolio sits in the top ten companies, how much in technology, and how the U.S. share of global value has moved. Our sector rankings and live market-cap data across more than 2,500 companies let you see those concentrations rather than guess at them.
If you find that a handful of U.S. mega-caps dominate your holdings, that is useful information whichever fund you pick.
MarketCapLens
Check your own exposure with live data
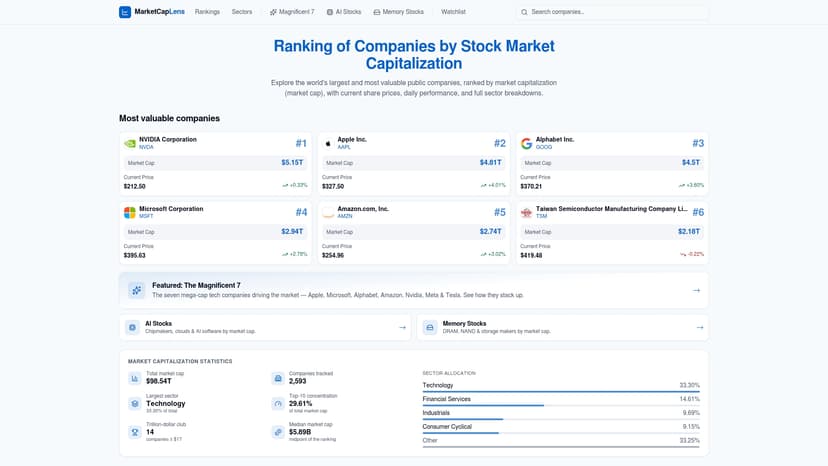
Before you commit, see what you would really own. MarketCapLens ranks over 2,500 public companies by market cap, with share prices refreshed several times a day and breakdowns by sector. Use the market cap rankings to see how large the biggest names are, browse sector rankings to spot where weight piles up, or run a five-step concentration audit on your current portfolio.
If you are buying in several lots, the stock average cost calculator shows your blended entry price, and the profit calculator turns it into a gain or loss figure.
A simple way to decide
- Write down your target split between U.S. and international stocks. If you have no view, the market’s own split (what VT holds) is a defensible default.
- Check what your other accounts already hold, including workplace plans.
- If you want the market split and zero maintenance, pick VT. If you want to control the split, pick VTI and add an international fund in the proportion you chose.
- Decide how often you will review it, and stick to it.
It is a decision you can revisit, and the cost of being “wrong” is small. Both are broad, cheap and diversified. The bigger risks are selling in a panic and chasing last year’s winner.
FAQ
Is VT or VTI better?
Neither is better for everyone. VT gives you global stocks in one fund for 0.06%, while VTI gives you U.S. stocks for 0.03%. The right one depends on whether you want the world’s market split or want to set your own international allocation.
What type of ETF is VT?
VT is a global equity ETF run by Vanguard that tracks the FTSE Global All Cap Index. It holds large-, mid- and small-cap stocks in developed and emerging markets, with more than 10,000 holdings as of September 30, 2026, and is weighted by company size.
Has VTI beaten VT?
Over the ten years measured in a July 2026 comparison, yes: 243.92% against 230.52%. Over the following twelve-month window, VT led, 23.59% against 21.5%. Which one wins depends on the dates you choose.
Do I need VTI if I own VT?
No. VT already includes U.S. stocks, at roughly 62% of the fund according to a February 2026 estimate. Adding VTI would only raise your U.S. weighting, which is fine if that is deliberate.
Can I hold VT alone for the long term?
Many investors do, because it covers the whole investable stock market and self-adjusts as market values change. It holds only stocks, so decide separately how much to keep in bonds or cash based on your time horizon and risk tolerance.
Sources
- Vanguard Total Stock Market ETF fact sheet
- Vanguard Total World Stock ETF (VT) fund details
- Vanguard Total World Stock ETF product page
- 24/7 Wall St.: VT vs. VTI, whole world or just America
- JL Collins: VTSAX and chill? Maybe it’s time to lose the SAX
Recommended
For informational purposes only and is not investment advice. Do not rely on the facts, figures, ticker symbols, or other statements in this article — they may be incomplete, outdated, or incorrect, and we are not responsible for errors. See our disclaimer.