VTI vs ITOT: Which Total Market ETF Fits You?
By MarketCapLens · Published · 10 min read
For most investors, VTI and ITOT are close to interchangeable. Both charge a 0.03% expense ratio, both give you the entire U.S. stock market in one ticker, and their returns have run within a rounding error of each other. VTI holds more stocks (about 3,500 versus about 2,450) and tracks a different index. ITOT is a good fit if the rest of your portfolio sits at iShares. Below, we walk through what actually separates them so you can pick one and move on.
MarketcaplensSee What Drives Total-Market FundsExplore company rankings, sector breakdowns, and market trends to put the holdings behind broad U.S. market funds in context.Explore company dataTL;DR
- Cost: Both funds have a 0.03% expense ratio, so fees do not decide this.
- Index: VTI tracks the Morningstar US Total Market Index. ITOT tracks the S&P Total Market Index.
- Holdings: VTI held 3,519 stocks and ITOT 2,442, but about 97% of their weight overlaps, and Nvidia, Apple and Microsoft lead both.
- Returns and risk: Over the periods published, total returns differ by a tenth of a percentage point or less, and five-year maximum drawdowns were identical.
- Pick: Choose VTI for the broadest coverage and the Vanguard share-class structure. Choose ITOT if you already hold iShares funds. Then stop comparing and keep investing.
Table of Contents
- What each fund tracks
- Side-by-side comparison
- Cost: a tie that is hard to beat
- Holdings and market-cap coverage
- Sector weights: read the labels carefully
- Performance and risk
- Trading and liquidity
- Taxes and structure
- Which one should you choose?
- Perspective
- See what drives your total-market fund
- FAQ
- Sources
What each fund tracks
Both funds aim to own the U.S. equity market across large, mid and small companies. They get there with different benchmarks.
VTI (Vanguard Total Stock Market ETF). Its summary prospectus says the fund seeks to track a benchmark measuring the overall stock market. The benchmark is the Morningstar US Total Market Index, which Vanguard’s fact sheet describes as representing approximately 100% of investable companies in the U.S. equity market. VTI shares are listed on NYSE Arca and, like any ETF, are bought and sold in the secondary market through a brokerage account. Unless your broker imposes one, there is no minimum dollar amount or minimum number of shares.
ITOT (iShares Core S&P Total U.S. Stock Market ETF). According to the iShares product page, ITOT seeks to track the S&P Total Market Index and launched on January 20, 2004. Per its summary prospectus, that index is built from the S&P 500 and the S&P Completion Index, which made up roughly 88% and 12% of the fund’s market capitalization as of March 31, 2026.
So the answer to “are they the same?” is: same job, different index providers, different fund companies. In practice the two indexes describe nearly the same universe. If you want to understand why index construction matters at all, our guide to how MSCI and S&P methodologies differ shows how the same market can be cut in different ways.
Side-by-side comparison
| Feature | VTI | ITOT |
|---|---|---|
| Issuer | Vanguard | iShares (BlackRock) |
| Benchmark | Morningstar US Total Market Index | S&P Total Market Index |
| Expense ratio | 0.03% | 0.03% |
| Holdings | 3,519 (Sept. 30, 2026) | 2,442 (Oct. 29, 2026) |
| Distributions | Quarterly | Quarterly |
| Trailing 12-month yield | 1.06% (Nov. 3, 2026) | 1.02% (Nov. 3, 2026) |
| Top three holdings | Nvidia, Apple, Microsoft | Nvidia, Apple, Microsoft |
| Structure | ETF share class of a Vanguard mutual fund | Stand-alone ETF |
Sources: Vanguard fact sheet, iShares, DividendVision yield comparison, and The Motley Fool.
Cost: a tie that is hard to beat
Both funds charge 0.03%, or $3 a year per $10,000 invested. For perspective, Vanguard’s fact sheet puts VTI’s ratio against 0.97% for the multi-cap core fund average and 0.46% for the ETF-only average. iShares makes the same point from its side, saying ITOT delivers total-market exposure for less than one-twentieth of the average fee of the comparable active mutual fund.
The point for you: whichever you pick, you have already won the cost battle. A 0.00% difference cannot separate them.
Holdings and market-cap coverage
This is where the funds visibly differ, though less than the headline numbers suggest.
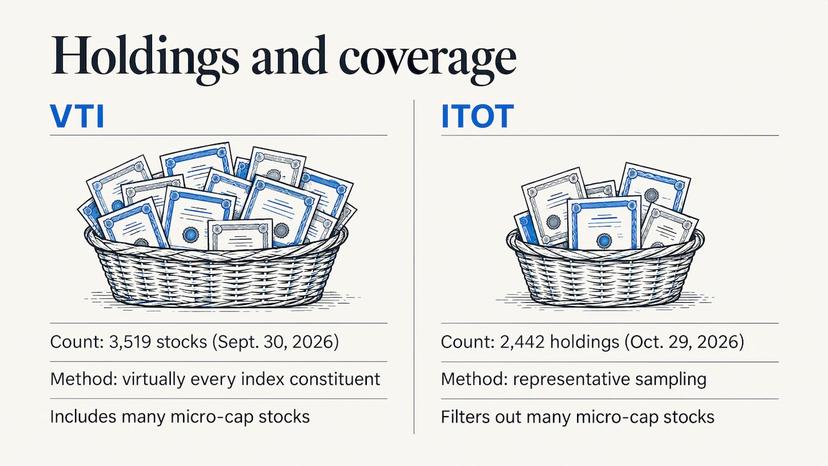
VTI held 3,519 stocks as of September 30, 2026, per Vanguard. ITOT held 2,442 holdings as of October 29, 2026. The gap comes from two things. First, ITOT uses representative sampling, while VTI holds virtually every constituent of its index. Second, VTI includes many micro-cap stocks that ITOT filters out.
Micro-caps are tiny companies, and they carry a very small share of the fund’s dollars. That is why the overlap figures look the way they do.
How much do VTI and ITOT overlap?
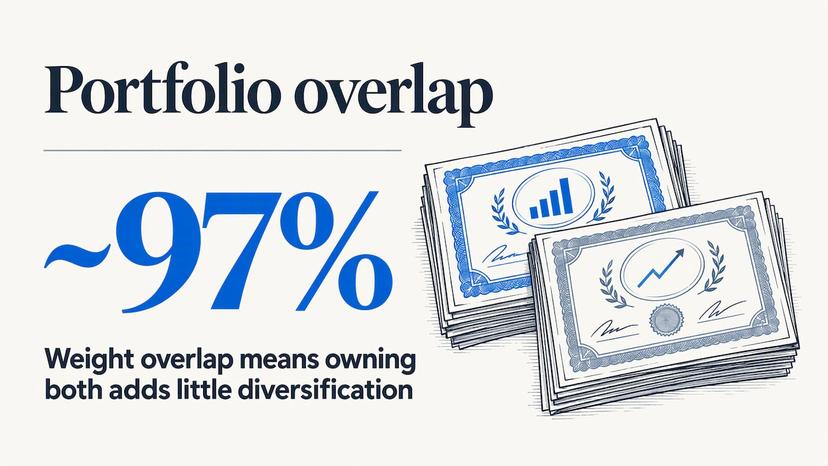
A lot. One holdings-overlap tool using June 30, 2026 reports found that the two funds share 2,391 holdings and that their weights overlap by about 97%, with nearly all of ITOT’s names also sitting in VTI. Put simply, if you own both, you are not diversifying. You are buying the same portfolio twice. The extra thousand or so stocks in VTI are mostly very small companies that move the total result only a little.
Top 10 holdings in VTI
As of September 30, 2026, Vanguard lists VTI’s top ten as:
- NVIDIA, 7.1%
- Apple, 6.6%
- Microsoft, 5.2%
- Alphabet, 4.9%
- Amazon, 3.3%
- Broadcom, 2.3%
- Meta Platforms, 2.2%
- Micron Technology, 1.6%
- Tesla, 1.4%
- AMD, 1.4%
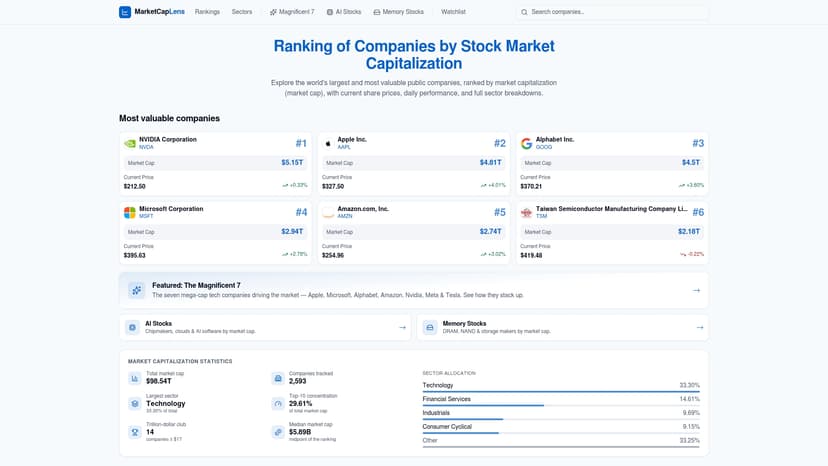
Together those ten make up 36.1% of net assets. Nvidia, Apple and Microsoft also top ITOT’s list. Both funds are cap-weighted, so the biggest companies drive results in either one. You can see the current ranking of those giants on our market cap rankings page, where values refresh multiple times a day.
Sector weights: read the labels carefully
Both funds lean heavily on technology, because the U.S. market does. Here is how each fund’s own provider reports it.
| Sector | VTI (Sept. 30, 2026) | ITOT (Oct. 29, 2026) |
|---|---|---|
| Technology | 43.1% | 36.17% |
| Financials | 9.7% | 12.37% |
| Health Care | 9.5% | 10.56% |
| Industrials | 11.4% | 9.14% |
| Consumer Discretionary | 11.4% | 8.92% |
| Communication / Telecommunications | 2.1% | 8.03% |
| Consumer Staples | 3.3% | 4.58% |
| Energy | 3.6% | 3.92% |
| Real Estate | 2.1% | 2.12% |
| Utilities | 2.1% | 2.02% |
| Materials | 1.5% | 1.97% |
Sources: Vanguard fact sheet and iShares.
Do not read the Technology and Communication rows as a real portfolio gap. The two providers draw sector lines differently and report on different dates. When one article compared the funds using a consistent classification, technology was 37% of VTI and 37.2% of ITOT. That is the number to remember: the sector exposure is effectively the same.
If you want to learn how to read these tables, start with our explainer on sector weightings. For the concentration question specifically, see our look at the tech sector’s weight in the market.
Performance and risk
When two funds hold nearly the same stocks at the same cost, their returns cannot diverge much. They did not.
- One year (published June 2026): ITOT returned 27.23% and VTI 27.29%. Five-year maximum drawdowns were both 25.40%. A $1,000 investment grew to $1,812 in ITOT and $1,810 in VTI over five years.
- One year (published August 2026): ITOT 23.3% and VTI 23.2%, with matching 25.4% five-year drawdowns.
- Beta: Both had a beta of 1.01 against the S&P 500, based on five years of monthly returns.
Notice that the leader changes depending on the date you measure. That is the sign of a coin flip, not an edge. Past returns do not predict future ones, and a total-market fund will fall when the market falls: a 25% drawdown happened to both funds inside five years. If that number makes you uneasy, our piece on drawdown versus volatility explains how to size a stock position to what you can actually sit through.
Trading and liquidity
Both are among the easiest ETFs to trade. VTI’s asset base is several times ITOT’s, which gives it a marginal liquidity edge, though both are described as extremely liquid. ITOT itself had net assets of about $97 billion on October 29, 2026. A larger fund can help someone moving very large dollar amounts. For a typical investor buying a few hundred or a few thousand dollars at a time, the difference is negligible.
Two practical habits matter more than the ticker:
- Use a limit order rather than a market order, especially in the first and last minutes of the session.
- Do not compare share prices. ITOT closed at $167.93 on October 29, 2026, per iShares, but a lower or higher per-share price says nothing about value. Most brokers offer fractional shares, and what matters is the percentage you own.
Taxes and structure
Both funds pay quarterly distributions, and both are generally tax-efficient in a taxable account. iShares notes that over the past 10 years, none of its Core U.S. equity ETFs, ITOT included, paid capital gains distributions. That is history, not a guarantee.
VTI is structurally a share class of a Vanguard total market mutual fund, which analysts say can bring specific tax-efficiency advantages over a stand-alone ETF. The same coverage suggests choosing VTI for that structure and ITOT for fit with an iShares or BlackRock portfolio.
Tax-loss harvesting
Because the funds track different indexes, some investors use one to replace the other after selling at a loss. Be careful here. U.S. wash-sale rules limit loss deductions when you buy a substantially identical security around a sale, and whether two funds qualify is a judgment call. Before you build a harvesting plan around this swap, confirm it with a CPA or tax professional who knows your full situation.
Which one should you choose?
Use these decision rules.
- You want the widest possible coverage and the simplest default: VTI. It holds about 1,000 more stocks and tracks an index aiming to represent roughly the entire investable market.
- Your brokerage account is built around iShares funds, or you hold other BlackRock ETFs: ITOT. Keeping everything with one issuer can simplify your statements.
- You already own one of them: Keep it. Switching in a taxable account can trigger a tax bill for a difference you cannot measure.
- You are tempted to buy both: Do not. With roughly 97% weight overlap, you add nothing.
The bigger decisions sit above this one: how much you save, your split between U.S. and international stocks and bonds, and whether a single sector holds too much of your portfolio. One practitioner guide makes the point that time spent debating marginal differences is better spent on savings rate and long-term allocation. Our article on sector diversification benefits and limits helps with that second layer.
Perspective
We look at thousands of public companies ranked by market capitalization every day, and one thing stands out when you compare two total-market funds: market cap does the heavy lifting. Both VTI and ITOT are cap-weighted, so a handful of mega-cap names set the tone for the whole fund. The top ten holdings in VTI alone are 36.1% of its assets.
That is why we encourage investors to look past the ticker and at what sits inside it. Check the sector split, see how concentrated the top of the ranking is, and track those leaders live. Two funds that look different in a sector table can be nearly identical underneath, as this comparison shows.
Our approach is to give you the data, refreshed multiple times daily across more than 2,500 companies, in plain English, so you can make the decision yourself. Choosing between VTI and ITOT takes ten minutes. Understanding what you own takes a little longer, and it is worth it.
MarketCapLens
See what drives your total-market fund
Whichever ETF you choose, most of its movement comes from the largest companies in it. MarketCapLens tracks over 2,500 public companies by market cap, with share prices and sector breakdowns updated multiple times a day. Open the market cap rankings to see today’s biggest names, or browse companies by sector to see how the weights shown above are built.
Want to run the numbers on a single stock yourself? Our stock calculators cover market cap, value and returns.
FAQ
Are ITOT and VTI the same?
No, but they are very close. Both aim to cover the total U.S. stock market for 0.03% a year, yet VTI tracks the Morningstar US Total Market Index and ITOT tracks the S&P Total Market Index. VTI holds roughly 1,000 more stocks, mostly small companies, and about 97% of the funds’ weights overlap.
Is VTI or ITOT better for a long-term investor?
Neither has a measurable edge. Costs are identical, and published one-year returns differ by about a tenth of a point or less, with the lead changing by period. VTI suits investors who want the broadest coverage, and ITOT suits those already invested in iShares funds.
Can I own both VTI and ITOT?
You can, but it adds almost no diversification. With roughly 97% weight overlap and the same top holdings, you would hold nearly the same portfolio twice. A better use of a second fund is exposure the first lacks, such as international stocks or bonds.
Which pays the higher dividend yield?
As of November 3, 2026, VTI’s trailing 12-month yield was 1.06% and ITOT’s was 1.02%, according to DividendVision. Both pay quarterly. The gap is small and changes with prices, so check each provider’s page for the current figure.
Is it worth switching from ITOT to VTI, or the reverse?
Usually not. The funds are so similar that switching rarely improves your results, and selling in a taxable account can create a taxable gain. If you are considering it for tax-loss reasons, talk to a tax professional first.
Sources
- Vanguard Total Stock Market ETF summary prospectus
- Vanguard Morningstar Total Stock Market ETF fact sheet (September 30, 2026)
- Vanguard fact sheet with sector allocation and expense comparison
- iShares Core S&P Total U.S. Stock Market ETF product page
- iShares ITOT summary prospectus
- iShares Core U.S. Equities Product Brief
- The Motley Fool: Which total U.S. stock market ETF is better (June 2026)
- The Motley Fool: ITOT vs VTI (August 2026)
- Hahn Invest: VTI vs ITOT
- PortfoliosLab: ITOT vs VTI holdings overlap
- DividendVision: core index fund comparison
- ETF BFF: VTI vs ITOT liquidity
- AOL: three total market ETFs compared
- MyETFJourney: how to compare similar ETFs
Recommended
For informational purposes only and is not investment advice. Do not rely on the facts, figures, ticker symbols, or other statements in this article — they may be incomplete, outdated, or incorrect, and we are not responsible for errors. See our disclaimer.