VUG vs QQQ: Holdings, Costs and Performance Compared
By MarketCapLens · Published · 9 min read
VUG and QQQ are both large-cap growth ETFs with heavy technology exposure, and the difference comes down to three things: the index each tracks, what it costs, and how concentrated the portfolio is. VUG follows a broad Morningstar growth index of 135 stocks at a 0.03% expense ratio. QQQ follows the Nasdaq-100, about 100 companies, at 0.18%. If you want the cheaper and wider net, VUG fits. If you want the Nasdaq-100 specifically, QQQ is the fund. Either way, check the live market caps behind each fund before you buy, which you can do on MarketCapLens.
MarketcaplensLook Beyond the ETF LabelsCompare the companies behind VUG and QQQ with live share prices, market capitalizations, sector breakdowns, and historical market data.VisitTL;DR
- Index: VUG tracks the Morningstar US Large Cap Growth Index. QQQ tracks the Nasdaq-100.
- Cost: VUG’s expense ratio is 0.03%. QQQ’s is 0.18%.
- Holdings: VUG held 135 stocks as of September 30, 2026, with its top ten making up 65.7% of assets. QQQ holds about 100 companies.
- Overlap: Both are dominated by the same mega-cap technology names, so owning both adds little diversification.
- Decision rule: Pick one for your core growth slot, then monitor concentration with live market cap data.
Table of Contents
- What VUG and QQQ are
- Side-by-side snapshot
- Costs: 0.03% vs 0.18%
- Holdings: what you actually own
- Performance: what the numbers say, and what they do not
- Risk: concentration is the real variable
- How to choose between VUG and QQQ
- Check the funds with live data
- Our view
- FAQ
- Sources
What VUG and QQQ are
An ETF (exchange-traded fund) is a basket of stocks that trades on an exchange like a single share. Both of these funds are passively managed: they do not try to beat an index, they copy it.
VUG is the Vanguard Morningstar Growth ETF. According to Vanguard’s fund document, it seeks to track the Morningstar US Large Cap Growth Index with a full-replication strategy, meaning it buys all or substantially all of the index’s stocks in roughly the same proportions. It launched on January 26, 2004, and the September 30, 2026 document shows $232,870 million in net assets and 135 stocks.
QQQ is the Invesco QQQ ETF. Invesco describes it as passively managed and tracking the Nasdaq-100 Index of 100 companies, with a history dating to 1999. It is highly liquid and among the most actively traded securities.
The key difference is how each index picks its stocks. The Morningstar index screens the large-cap U.S. market for growth characteristics, so it can hold a stock listed on either major exchange. The Nasdaq-100 is a list of Nasdaq-listed companies. That is why many investors treat VUG as a purer growth strategy and QQQ as an exchange-defined bet that happens to lean toward growth.
Side-by-side snapshot
| VUG | QQQ | |
|---|---|---|
| Index | Morningstar US Large Cap Growth | Nasdaq-100 |
| Expense ratio | 0.03% | 0.18% |
| Number of holdings | 135 (Sept. 30, 2026) | About 100 |
| Management style | Passive, full replication | Passive, index tracking |
| Inception | January 26, 2004 | March 10, 1999 |
| Issuer | Vanguard | Invesco |
Sources: Vanguard VUG fund document and Invesco’s QQQ page.
Costs: 0.03% vs 0.18%
VUG’s expense ratio is 0.03%, per Vanguard’s fund page (as of April 28, 2026), with no purchase or redemption fees. QQQ’s total expense ratio is 0.18% on Invesco’s page. It was 0.20% until QQQ’s reclassification from a unit investment trust to an ETF structure, which Invesco explains lowered the fee and allowed income reinvestment, futures and securities lending.
What does 0.15 percentage points mean in dollars? On a $10,000 holding, 0.03% is $3 a year and 0.18% is $18 a year. That is a $15 gap, before any difference in returns. On $100,000 it is $150 a year. Fees are charged inside the fund and reflected in its price, so you never see a bill.
Two other costs matter at the margin:
- Bid-ask spread. Vanguard’s page showed a $0.06 (0.04%) spread on VUG. Invesco notes that spreads and premiums or discounts to net asset value can affect the price you pay for QQQ. For long-term buyers placing limit orders, this is small. For active traders, QQQ’s heavy trading volume is a real benefit.
- Broker commissions. Vanguard states VUG shares can be bought and sold only through a broker, which may charge a commission. Invesco says you can typically buy a single share of QQQ through online brokers, and some allow fractional shares.
If the price of one QQQ share feels high, the sister fund is worth a look: our QQQM vs QQQ comparison covers fees, liquidity and which to own.
Holdings: what you actually own
The holdings are where the funds look most alike, and where VUG’s numbers surprise people who think of it as the “broad” option.
As of September 30, 2026, Vanguard’s document lists VUG’s ten largest positions:
| Rank | Holding | Weight in VUG |
|---|---|---|
| 1 | NVIDIA | 13.5% |
| 2 | Apple | 12.5% |
| 3 | Microsoft | 9.7% |
| 4 | Alphabet | 9.2% |
| 5 | Broadcom | 4.3% |
| 6 | Amazon | 4.3% |
| 7 | Meta | 4.2% |
| 8 | AMD | 2.7% |
| 9 | Tesla | 2.7% |
| 10 | Eli Lilly | 2.6% |
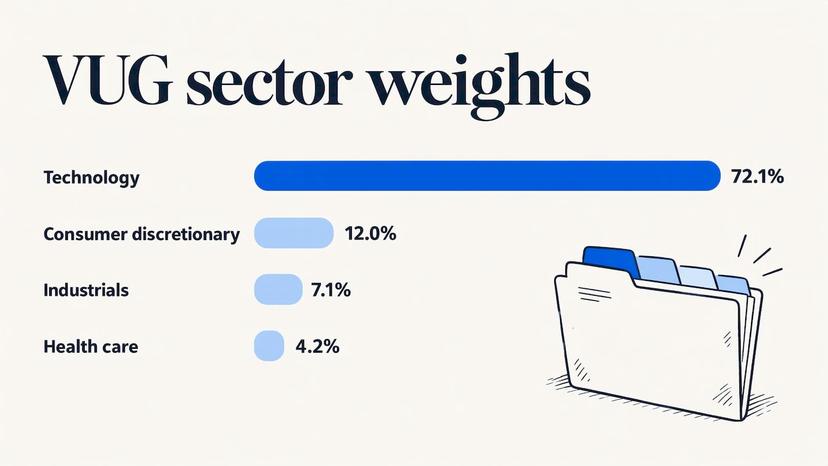
The top ten total 65.7% of net assets. The same document shows sector weights (ICB classification) of 72.1% Technology, 12.0% Consumer Discretionary, 7.1% Industrials and 4.2% Health Care, with every other sector at 1.5% or less.
So VUG has more stocks than QQQ, yet two thirds of the money sits in ten names. The count of holdings tells you little. The weight of the top positions tells you much more.
QQQ follows the same pattern with a different rulebook. The Nasdaq-100 is made up of about 100 large Nasdaq-listed companies, and its biggest members are the same mega-cap technology and internet leaders you see in VUG’s top ten. Exact QQQ weights change with every market move and index rebalance, so read the current list on Invesco’s QQQ page rather than a number copied into an article.
Does owning both make sense?
For most investors, no. Because both funds hold the same giants, buying VUG and QQQ together mostly raises your bet on a handful of companies. If you want to see how stacked a portfolio already is, our five-step portfolio audit for market cap concentration walks through the check with live data.
Performance: what the numbers say, and what they do not
Performance is where the two funds get compared most, and where the comparison is easiest to misuse. Three points keep it honest.
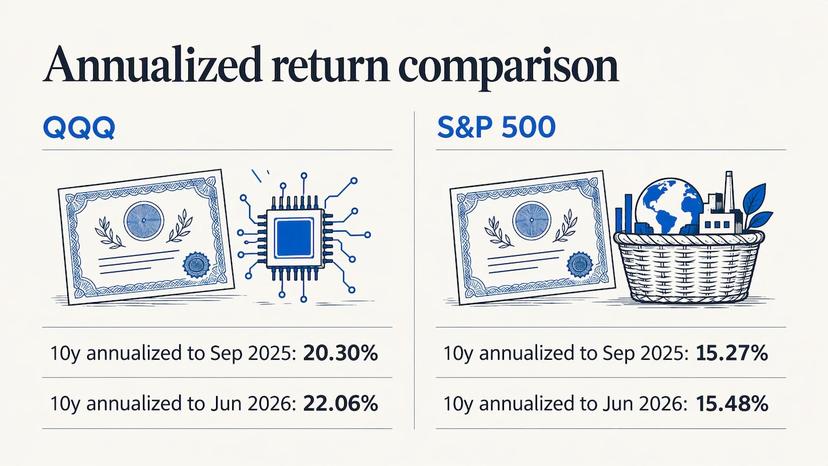
First, the periods are not the same. Invesco reports that over the ten years ending June 30, 2026, QQQ’s annualized NAV return was 22.06%, against 15.48% for the S&P 500, on its product page. An earlier Invesco release put the ten years to September 30, 2025 at 20.30% against 15.27%. Those are long, strong stretches, driven by the same technology leadership both funds share.
Second, the two funds have behaved similarly because they own similar things. Both rise when mega-cap technology rises and both fall when it does not. VUG’s own page shows a year-to-date return of 5.14% on NAV as of November 11, 2026, and its standard deviation (a measure of how much returns swing) was 16.84% as of September 30, 2026. Returns for a short window like that move daily, so use the fund page for today’s figures.
Third, small gaps between the two usually come from index rules, not skill. A few percentage points of difference over a year can come from which stocks each index holds and how heavily. The fee gap is a fixed, known drag on QQQ of 0.15 points a year. The rest depends on what the market rewards.
The practical reading: past returns for either fund show how that strategy behaved in one market. They do not promise the next decade will look the same. For anything involving your own money, a fee-only financial adviser or your broker’s licensed representative can match a fund to your goals and tax situation.
Risk: concentration is the real variable
Both funds are equity funds, and both can lose a lot in a bad year for technology. VUG’s technology weight of 72.1% and top-ten share of 65.7% mean a drop in a few stocks moves the whole fund. QQQ shares that profile.
Three questions help you size the risk:
- How much of my portfolio is already in these names? If you own an S&P 500 fund, you already hold NVIDIA, Apple and Microsoft. Our look at S&P 500 top-10 concentration shows how large that share has become.
- How much technology do I hold overall? Compare it with the S&P 500 tech sector weight to see whether you are tilted.
- What is my time horizon? A fund with a 16.84% standard deviation can swing sharply within a year. Money needed in a few years belongs elsewhere.
Our guide to running live data checks for market concentration risk turns these questions into a routine.
How to choose between VUG and QQQ
Start from what you want the fund to do in your portfolio.
Choose VUG if you want a growth holding at the lowest cost, with 135 stocks screened for growth characteristics and not tied to one exchange. At 0.03%, it is the lower-cost option for a buy-and-hold core position.
Choose QQQ if you want the Nasdaq-100 itself, you trade often and value its very high liquidity, or you want the index that Invesco says has a 755.89% cumulative outperformance against the S&P 500 since its March 10, 1999 inception (as of June 30, 2026, NAV, per Invesco).
Choose neither as your only holding if you need broad diversification. A total-market or S&P 500 fund spreads risk wider. See VT vs VTI or SPY vs VOO for those decisions, and practical sector allocation starter plans for building around a growth core.
Keeping the allocation on target
Growth funds can grow into a bigger share of your portfolio after a strong run. Setting a target weight and rebalancing back to it is the standard fix, and some investors use automated portfolio rebalancing strategies to apply the rule consistently. Decide the rule before the market tests it.
Check the funds with live data
An ETF is only as diversified as its largest holdings, and those weights shift every day. MarketCapLens tracks more than 2,500 public companies by market capitalization, with prices and sector breakdowns refreshed multiple times daily.
To apply that to this comparison, open the market cap rankings and look at where the names in VUG’s top ten sit today. Then use the technology sector page to see how much of the largest companies’ value the sector accounts for, and the stock calculators to run size and return figures on the holdings you care about.
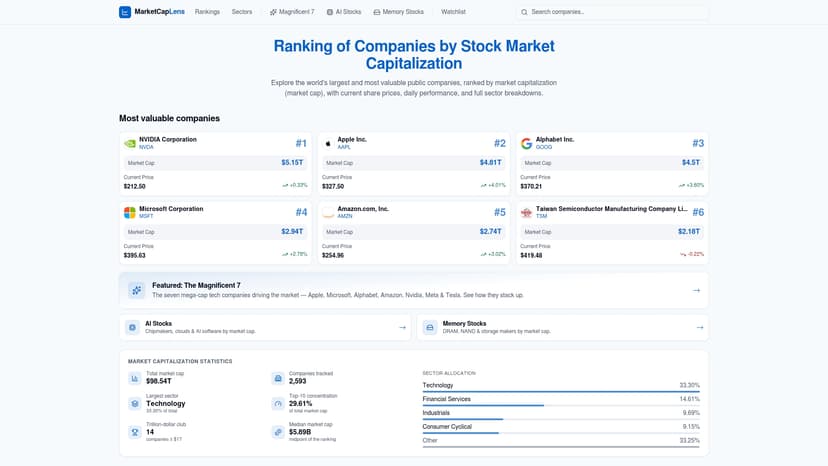
The rankings page is the quickest way to see how a few companies can drive the value of any cap-weighted growth fund.
Our view
Both funds answer the same question: how do I own the biggest growth companies without picking them one by one? The honest differences are small and measurable: 0.03% against 0.18% in fees, 135 stocks against about 100, and two different indexes.
The bigger lesson sits underneath. Market-cap-weighted funds hand the largest companies the largest weights, so what you own is decided by market value. VUG’s top ten at 65.7% shows it plainly.
That is why we built MarketCapLens around live rankings, sector breakdowns and historical data for more than 2,500 companies. Before you pick between two funds, see the companies behind them, in plain English, and watch how their weights change.
MarketCapLens
FAQ
Is QQQ like VUG?
They are similar in spirit and in their biggest holdings. Both are passively managed large-cap growth funds weighted toward technology. They differ in index (Nasdaq-100 for QQQ, Morningstar US Large Cap Growth for VUG), number of holdings and cost.
Which is better for long-term investing, VUG or QQQ?
Both suit long-term holders. VUG’s 0.03% expense ratio is lower than QQQ’s 0.18%, which matters over decades. QQQ’s appeal is its Nasdaq-100 exposure and liquidity. Your own goals and tax situation should decide, ideally with a licensed financial adviser.
Can I hold VUG and QQQ together?
You can, but the overlap is large. Both hold NVIDIA, Apple, Microsoft and other mega-caps, so a combination mostly increases your concentration in the same companies instead of adding variety.
How do I buy VUG or QQQ?
Through a brokerage account. Vanguard states VUG can only be bought and sold through a broker, and Invesco notes QQQ can typically be bought as a single share, with fractional shares at some brokers. Check your broker’s commission schedule first.
Sources
- Vanguard Morningstar Growth ETF fund document, September 30, 2026
- VUG, Vanguard Morningstar Growth ETF fund page
- Invesco QQQ ETF
- What’s new about QQQ? (Invesco, December 22, 2025)
Recommended
For informational purposes only and is not investment advice. Do not rely on the facts, figures, ticker symbols, or other statements in this article — they may be incomplete, outdated, or incorrect, and we are not responsible for errors. See our disclaimer.