VWAP Explained: Formula, Example and How to Use It
By MarketCapLens · Published · 11 min read
VWAP, or volume-weighted average price, is the average price a stock has traded at during a session, with each trade counted in proportion to its size. A price printed on 50,000 shares moves the line far more than one printed on 100 shares. On a chart it shows up as one line that follows the price through the day, and it answers a simple question: is the stock trading above or below what most of the money paid today?
This guide covers the meaning, the formula, a worked example you can check by hand, the ways traders use it, how it differs from a moving average, and where it misleads.
MarketcaplensPut VWAP in Market ContextCompare company performance with market trends, historical data, and sector breakdowns using MarketCapLens.Explore market dataTL;DR
- VWAP is the average price of a session weighted by volume, so heavily traded prices count more than thinly traded ones.
- It is calculated as cumulative (typical price × volume) divided by cumulative volume, and it resets at the start of every trading day.
- Short-term traders read price above VWAP as strength and price below it as weakness. Institutions use it mainly as an execution benchmark.
- It is built from past trades and does not predict anything. It also lags more as the day goes on.
- A moving average covers many days and ignores volume. VWAP covers one session and depends on it.
Table of Contents
- What VWAP means for stocks
- How VWAP is calculated
- How traders use VWAP
- How to use VWAP on a chart
- VWAP vs moving average
- VWAP vs TWAP
- Where VWAP falls short
- Our perspective
- Put VWAP in context with MarketCapLens
- FAQ
- Sources
What VWAP means for stocks
VWAP is a technical indicator that calculates a security’s average price for the day, weighted by trading volume. Investopedia describes it as a way to analyze price trends and liquidity within a single session. A more formal definition treats it as the ratio of the total value traded to the total volume traded over a defined period, typically one trading session. It serves two jobs: a benchmark for judging how well an order was executed, and a chart indicator.
The volume weighting matters because a simple average treats every price equally. Suppose a stock trades at $50.00 for a few minutes on tiny volume, then spends the afternoon near $51.00 on heavy volume. A plain average of the prices would sit near the middle. VWAP sits close to $51.00, because that is where the shares changed hands.
That is also why VWAP is often described as the price level that reflects where participants have actually transacted. It is a fair-price reference for the day, not a forecast.
How VWAP is calculated
In its purest form, you add up the dollars traded in every transaction (price times shares) and divide by the total shares traded. Investopedia writes it as the sum of tick price times tick volume, divided by trading volume.
Most charting platforms do not work tick by tick. They use a substitute formula on each bar or candle: cumulative (typical price × volume) divided by cumulative volume, where the typical price is the high plus the low plus the close, divided by three. The same source notes that popular charting packages use this version.
The step-by-step method
The calculation starts from the open and updates in real time until the close, so it uses intraday data only. The steps are:
- Find the typical price of the first completed candle: (high + low + close) / 3.
- Multiply that typical price by the candle’s volume to get the price-volume figure.
- For the first candle, VWAP equals the typical price.
- For each later candle, add its price-volume figure to a running total, and add its volume to a running volume total.
- Divide the running price-volume total by the running volume total.
A worked example with three candles
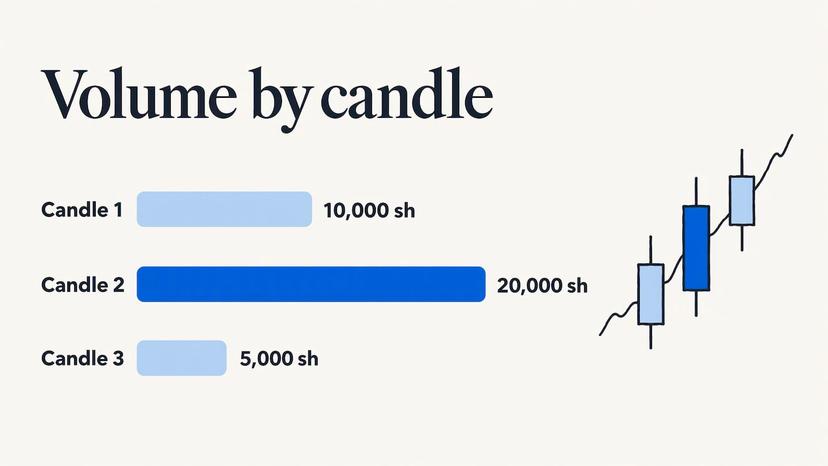
Here are three five-minute candles for a made-up stock. The numbers are invented to show the arithmetic.
| Candle | High | Low | Close | Typical price | Volume | Price × volume |
|---|---|---|---|---|---|---|
| 1 | $50.40 | $49.80 | $50.20 | $50.1333 | 10,000 | $501,333 |
| 2 | $50.60 | $50.10 | $50.50 | $50.4000 | 20,000 | $1,008,000 |
| 3 | $50.70 | $50.30 | $50.35 | $50.4500 | 5,000 | $252,250 |
After candle 1, VWAP is $50.13, because the first candle’s VWAP is its typical price.
After candle 2, the running price-volume total is $1,509,333 and the running volume is 30,000. Divide one by the other and VWAP is about $50.31. Candle 2 had twice the volume of candle 1, so the line is pulled toward its $50.40 typical price.
After candle 3, the totals are $1,761,583 and 35,000 shares, so VWAP is about $50.33. The third candle printed the highest typical price, but with only 5,000 shares it nudges the line by two cents.
That is the whole idea: the line moves slowly when volume is already large and quickly early in the session, when each new candle is a bigger share of the total.
How traders use VWAP
As a quick read on intraday strength
Short-term traders use VWAP to judge intraday price trends and to gauge the value of a stock relative to its trading volume. The common reading is simple. A stock holding above VWAP is trading above the average price paid so far today. A stock below it is trading under that average. Some traders treat shares below VWAP as undervalued and shares above as overvalued, which makes the line a rough reference for entries and exits.
In practice, many day traders watch what happens when the price approaches the line. It often acts as a level where buyers step in during a pullback, or where rallies stall. Treat that as a pattern traders watch for, not a rule the market obeys.
As an execution benchmark for large orders
The heaviest users are institutions. Researchers at Stanford describe VWAP as the most common benchmark price for execution. It encourages a broker to spread an order evenly across the market day, which reduces market impact and makes the order harder to detect. The same paper notes that it leaves most of the risk of market price movement with the client, so the broker can concentrate on execution itself.
Other research agrees. A paper in IISE Transactions calls VWAP a key measure of execution quality for large orders often used by institutional investors. A Bloomberg paper adds that VWAP is an average rather than a point-in-time price, which gives it stability, and that it is transparent and easily understood by market participants. It also reports that the industry standard is to use VWAP for passive executions, while implementation shortfall is used for aggressive ones.
For large buyers, the goal is usually to pay less than VWAP. For large sellers, it is to sell above it. Institutions try to buy below VWAP or sell above it, so that their actions push the price back toward the average rather than away from it.
A VWAP order
When a trader chooses a VWAP order, the aim is to cut execution costs. The order is split into smaller pieces that trade over a pre-set period, to get a price as close as possible to the volume-weighted average for that period. That is a different job from the indicator on your chart, even though the name is the same.
How to use VWAP on a chart
Most charting platforms offer VWAP as a built-in indicator. Add it to an intraday chart (1-minute to 30-minute candles work best), and it will reset at each new session. A few practical habits help.
- Use it on intraday charts only. Do not stretch it across several days. VWAP restarts at the open of every trading day, and an average built over many days can distort the indicator.
- Read the side first. Note whether the price is above or below the line before you think about an entry. Context comes before signal.
- Watch the reaction at the line. A pullback that holds at VWAP in an uptrend tells you more than a single touch.
- Pair it with volume and the broader trend. VWAP says where the average trade happened. It does not say whether the market is open to a move.
- Size your risk before you act. If you add to a position near VWAP, see how it changes your break-even with the stock average cost calculator.
Timing matters too. Early in the session, VWAP moves fast because few trades are in the average. Later it becomes sluggish, since thousands of prior trades anchor it.
VWAP vs moving average
Both tools smooth price, but they are built differently. According to Investopedia, a simple moving average averages closing prices over a set number of periods, such as 20 or 50 days, and ignores volume. VWAP covers one day and weights by volume. That makes VWAP more responsive to real-time trading, and the moving average better suited to longer-term trend analysis.
| VWAP | Simple moving average | |
|---|---|---|
| Time frame | One session, resets daily | Many periods, such as 20 or 50 days |
| Uses volume | Yes | No |
| Input | Intraday prices and volume | Closing prices |
| Typical use | Intraday trades and execution benchmark | Longer-term trend direction |
They do not compete. A swing trader might use a 50-day average to decide which stocks are in an uptrend, then look at VWAP on the day to choose a reasonable entry. For a wider framework on reading trends, see our five-step stock market trend analysis.
VWAP vs TWAP
TWAP is the time-weighted average price. It slices an order into equal pieces over equal time intervals and ignores volume. VWAP slices the order in proportion to expected volume, so it trades more when the market is busy. On liquid stocks with a clear daily volume pattern, VWAP follows the market’s natural rhythm. TWAP is simpler and is used when volume is hard to forecast. If you want to see how a time-sliced schedule works in another market, there is a walkthrough of TWAP execution for crypto traders. It also shows why the execution schedule matters more than the label on the order.
Where VWAP falls short
VWAP is useful, but it has clear limits, and knowing them keeps you out of trouble.
- It is backward-looking. It is based on historical values and has no predictive calculation built in.
- It lags more as the day goes on. The line is anchored to the opening range, so the longer the session runs, the slower it reacts.
- Strong trends can ignore it. In a sharp uptrend, a stock can climb for days without ever falling below VWAP, so waiting for a dip to the line can mean missing the move.
- It says nothing about the next day. It resets at the open.
There is also a matter of what a benchmark rewards. Because a VWAP order spreads trading evenly, it can follow a falling price down all day. The benchmark measures how close you got to the average, not whether the average was a good price to begin with. Researchers in the IISE paper found that static strategies were preferable to dynamic ones, and that modeling the link between volume and return variance significantly improved VWAP execution.
For risk beyond one session, volatility and drawdown tell a different story. Our guide to drawdown versus volatility covers that.
Our perspective
VWAP is a good example of an indicator that is easy to learn and easy to misuse. The formula is a few lines. The judgment is in knowing which question it answers: where did the day’s money trade, not where will the price go next.
We built MarketCapLens around the idea that context beats a single line. A stock’s price versus its VWAP is more meaningful when you also know the size of the company, how its sector is moving and how the price has behaved historically. Our database covers more than 2,500 listed companies, with data updated multiple times a day, so you can check that context quickly.
Our approach is to explain finance in plain English and give you a fuller, frequently updated market cap lens than a basic listing. Use VWAP for the one-day question, and use rankings, sector breakdowns and historical performance for the questions that take longer than a day.
MarketCapLens
Put VWAP in context with MarketCapLens
VWAP tells you about one stock on one day. MarketCapLens helps you with everything around it: which companies are the largest, how sectors compare, and how a stock has performed over time. You can browse companies ranked by sector and market cap, or open our stock calculators to work out profit, average cost, splits and implied share prices.
Before you rely on any intraday number, check how fresh your quotes are. Our guide on real-time versus delayed quotes explains when paying for live data makes sense. VWAP depends on current prices and volume, so stale data will give you a stale line. For a broader view of how index size affects what you own, read about market cap weighting.
FAQ
What does VWAP mean in stocks?
VWAP stands for volume-weighted average price. It is the average price at which a stock has traded during a session, with larger trades counting for more. It appears as a single line on an intraday chart, and traders compare the current price with it.
Is VWAP a good indicator?
It is a useful reference for intraday trading and a standard benchmark for execution quality. It is not predictive, because it is calculated from past trades, and it lags more as the session goes on. Most traders use it together with volume, trend and their own risk limits.
Can I use VWAP on daily or weekly charts?
Standard VWAP is built for a single session and restarts every day. Averaging it over many days can distort the result. For longer horizons, a moving average is the more common tool.
Should I buy above or below VWAP?
There is no fixed rule. Some traders consider stocks below VWAP undervalued and those above overvalued, while others read price above VWAP as strength. In a strong uptrend, the price may never fall back to the line, so waiting for a dip can mean a missed entry. Decide your entry and exit rules in advance.
Sources
- Volume-Weighted Average Price (VWAP): Definition and Formula, Investopedia
- Mastering VWAP: Common Strategies for Informed Trading, Investopedia
- Volume-weighted average price, Wikipedia
- Volume Weighted Average Price Optimal Execution, Stanford
- Volume-weighted average price tracking: A theoretical and empirical study, IISE Transactions
- Bayesian Trading Cost Analysis and Ranking of Brokers, arXiv
- VWAP execution and guaranteed VWAP, arXiv
- TWAP execution for crypto traders
Recommended
For informational purposes only and is not investment advice. Do not rely on the facts, figures, ticker symbols, or other statements in this article — they may be incomplete, outdated, or incorrect, and we are not responsible for errors. See our disclaimer.