Dual Listing and Market Cap: How to Count It Once
By MarketCapLens · Published · 11 min read

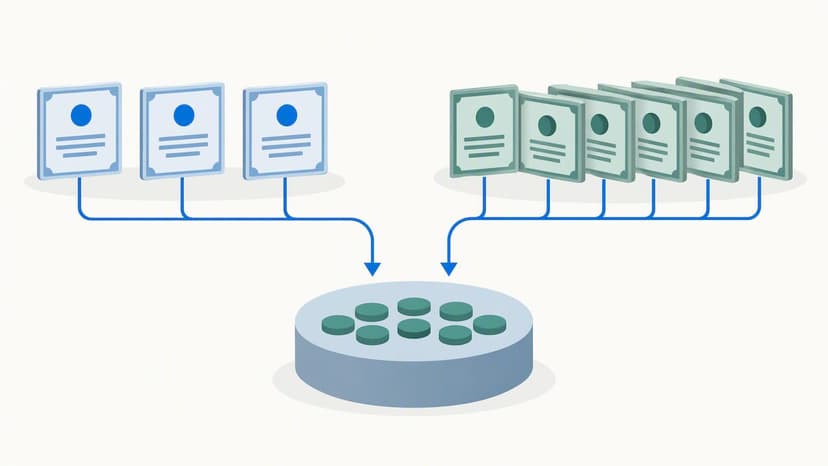
A dual-listed company has one market cap, not two. You calculate it by multiplying one share price by the total shares outstanding of the matching share class, then check that the price and the share count describe the same security. Adding the values from both exchanges counts the same business twice.
This guide shows how to do that in practice, what changes when one listing is an American depositary receipt (ADR), and how to verify a figure before you rely on it.
MarketcaplensCompare Companies, Not ListingsMarketCapLens brings together market capitalization rankings, share prices, historical data, and sector breakdowns to help you analyze companies across markets.Explore company rankingsTL;DR
- A dual listing puts the same company’s shares on a second exchange. It does not create a second company or a second market cap.
- Market cap is price multiplied by total shares outstanding. Use one price and the full share count, never the sum of both venues.
- If one listing is an ADR, convert it with the ADR ratio before you multiply, or you will be off by a factor of the ratio.
- Confirm share count, share class and ADR ratio in the company’s SEC filings, and note the date of any figure you quote.
- Rankings that merge tickers by company, not by listing, are the only fair way to compare dual-listed names.
Table of Contents
- What a dual listing actually is
- Why market cap is counted once
- How to calculate it, step by step
- When one listing is an ADR
- Currency, share classes and timing
- Where to verify the numbers
- Our perspective: rank companies, not tickers
- Compare dual-listed companies on one scale
- Common mistakes to avoid
- FAQ
- Sources
What a dual listing actually is
A dual listing means a company’s securities trade on more than one exchange. Nasdaq’s glossary notes that it can increase liquidity and lengthen the time the stock can be traded each day. Deutsche Börse describes it as a second listing on an exchange other than the company’s domestic one, and distinguishes it from an initial public offering. In plain terms, the second listing is another place to trade, not a new batch of ownership.
Investopedia adds that companies usually do this to broaden investor access, liquidity and access to capital. Many non-U.S. companies reach American investors through ADRs, which represent foreign shares held by a custodian bank.
Two things get confused with dual listing, and they matter for market cap:
- Dual-class shares. One company issues different share classes (say Class A and Class B) that may trade under different tickers. That is a different problem from listing on two exchanges. Our guide on dual-class shares and market cap explains why those tickers get combined.
- Cross-listing on a U.S. exchange via ADR. The U.S. line is a certificate for a fraction or multiple of a foreign share, so its price is not the home-market price.
If you want the basics first, start with what market capitalization is.
Why market cap is counted once
The formula does not change when a company lists twice. Market cap equals current market price times total outstanding shares. The Bombay Stock Exchange’s all-India market cap methodology states this formula. It also handles the multi-exchange problem directly: it identifies unique companies across exchanges, determines a single price for each one and multiplies it by the company’s total shares. A company listed on several exchanges is treated as one company when market cap is aggregated.
That is the logic to copy. Market cap measures what the whole company is worth at the market’s price. The shares are the same shares whichever screen you view them on. Adding the NYSE value and the London value of the same company would be like adding the price tag on a house to the price on its listing sheet.
The pitfall is not usually a deliberate double count. It happens when:
- A spreadsheet pulls two tickers for the same company and sums them.
- A data tool reports the share count for only one listing, then multiplies it by the other listing’s price.
- An ADR price is multiplied by the full ordinary share count without applying the ratio.
How to calculate it, step by step
- Identify the company, not the ticker. Find the issuer’s legal name and confirm that both listings belong to it. Company identifiers such as CUSIP or ISIN help tie listings to one issuer.
- Pick one primary line. Usually this is the home-market ordinary share, but the U.S. line works if you convert correctly.
- Find total shares outstanding for that class. Use the latest filing, not a rounded number from a summary page. Be careful to separate outstanding shares from float; our explainer on shares outstanding vs. float covers the difference.
- Take one price at one moment. Use a closing price for a specific date, and record the date.
- Convert currency if needed. If the price is in euros or pounds and you want dollars, apply the exchange rate for the same date.
- Multiply. Price times shares outstanding gives market cap.
- Cross-check with the other listing. After conversion, the implied value should be close to the first one.
The last step is a useful sanity test. Investopedia says prices for a dual-listed company should generally be similar across markets after allowing for currency conversion and transaction costs, though gaps can show up when trading hours do not overlap. If your two numbers differ by a large margin, you have probably mismatched a share count or a ratio.
You can run the multiplication in our market cap calculator.
When one listing is an ADR
This is where most U.S. readers get tripped up. The SEC’s Investor Bulletin on ADRs says an ADR represents an ownership interest in shares of a non-U.S. company held by a U.S. depositary bank, and that ADRs trade in U.S. dollars through U.S. settlement systems. Investor.gov’s ADR glossary entry explains that each ADR can represent one or more foreign shares, or a fraction of a share, and that its price corresponds to the home-market share price adjusted for that ratio.
So an ADR quote is not a per-share price. It is a price for a bundle.
A worked example from a real filing
A 2022 SEC prospectus supplement states that each ADS represented five ordinary shares, and cites an ordinary-share price of $0.188, which works out to $0.94 per ADS. Here is what happens if you get it wrong:
| Approach | Calculation | Result per share |
|---|---|---|
| Correct: convert the ADS price to a per-share price | $0.94 ÷ 5 ordinary shares | $0.188 |
| Wrong: treat the ADS price as a per-share price | $0.94 used directly | $0.94 (five times too high) |
If you multiplied $0.94 by the total ordinary shares, you would overstate the market cap fivefold. The reverse mistake (multiplying a per-share price by the ADS count) understates it. Always make sure that the unit of the price and the unit of the share count are the same.
A second filing shows the ratio can be large. An SEC-filed securities description from 2026 describes one American depositary share as representing 20 Class A ordinary shares, with the underlying shares held by the depositary’s custodian. A 20-to-1 ratio means a $10 ADS corresponds to a $0.50 ordinary share.
For a deeper walk-through, see our ADR market cap guide, which covers converting quotes and verifying with Form F-6.
ADRs and ordinary shares are separate securities, one company
SEC filings often register American depositary shares and ordinary shares as separate securities. ING’s filing is one example. That is a legal and trading distinction. For valuation, the ADSs are claims on the same underlying shares. Count the ordinary shares once.
ADR holders may also generally surrender ADRs to receive the underlying shares, according to the SEC’s bulletin. That link between the two lines is another reason to treat them as one pool of ownership.
Currency, share classes and timing
Three other factors can make two honest calculations disagree.
Currency. A company listed in London and New York has quotes in pounds and dollars. Convert using one exchange rate for one date. Do not mix a dollar price from today with a pound price from last week.
Share classes. Some dual-listed companies also have more than one class of shares, or shares with different voting rights. Use the total across classes when you want the whole company, and match each class’s price to its own count if the classes trade separately. Methods that skip this step miscount.
Timing. Exchanges close at different hours. At the moment you look, one market may be open and the other shut, so one price is stale. Compare closing prices from the same trading day where you can.
| Check | What to confirm |
|---|---|
| Same issuer | Both tickers map to one legal entity |
| Same share class | Price and share count describe the same security |
| ADR ratio applied | ADS price divided by shares per ADS, or multiplied by ADS count |
| Same currency | One exchange rate, one date |
| Same date | Closing prices from one trading day |
| Shares outstanding | Latest filing, not float |
Where to verify the numbers
Don’t rely on a single aggregator for a dual-listed name. Go to the issuer’s filings.
An issuer’s SEC registration documents can give you the security title, the exchange, the trading symbol, the ordinary shares outstanding and the ADS ratio, which is everything you need to rebuild a comparable market cap. You can search these on the SEC’s EDGAR database. Foreign private issuers typically file annual reports on Form 20-F. The ADR program’s registration statement (Form F-6) sets out the ratio.
Exchange figures are also tied to a date and a market. The NYSE’s international listings page cites a market capitalization for its listed-company community as of September 30, 2024, a good reminder that any total you read has an “as of” date and a scope. When you quote a market cap, quote both.
If the company also has fully diluted share counts (options, convertibles, warrants), the gap can be large. We walk through that in how analysts verify fully diluted market cap.
Our perspective: rank companies, not tickers
At MarketCapLens we track more than 2,500 public companies, and the hardest part of ranking them is not the arithmetic. It is deciding what counts as one company. A ranking that lists a business twice, once per exchange, pushes real companies down the table and makes the list say something false about size.
Our rule is simple. Each company appears once, with one market cap built from a consistent price and the full share count for the relevant classes. Where a company has several tickers, we treat them as one entity so that comparisons across sectors and countries stay fair. When you use a ranking page, check that the same discipline is applied before you compare two names. If it is not, you are comparing listings, not companies.
We also think the date matters as much as the number. A market cap from a single close tells you where a company stood that day, not what it is “worth” in some fixed sense. Our data refreshes multiple times a day, but for any decision that matters, check the filing behind the figure.
— MarketCapLens
Compare dual-listed companies on one scale
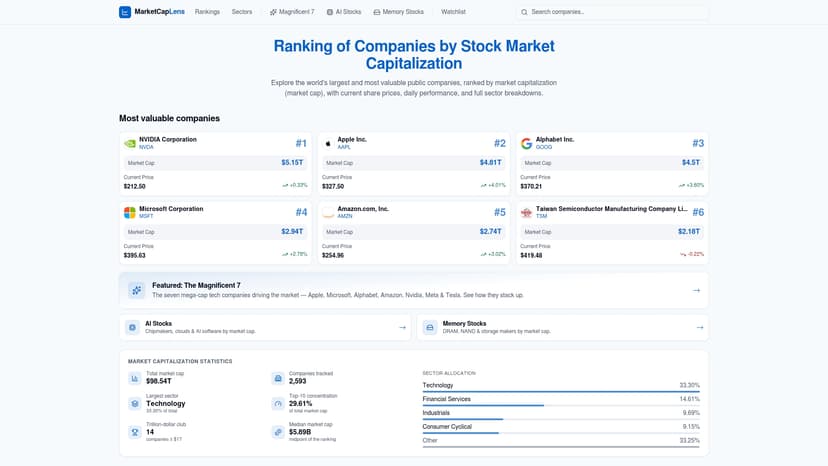
Once you know how to count each company once, the next step is seeing where it sits among its peers. Our market cap rankings list the world’s largest public companies by market capitalization, with share prices and daily performance, and our sector pages show how a company compares inside its industry.
If you have a price and a share count and just want the product, the market cap calculator does it in one step. For a broader set of tools, see our stock calculators.
Common mistakes to avoid
- Summing two tickers. The most common error. One company, one market cap.
- Using the ADS price with the ordinary share count. Divide or multiply by the ratio first.
- Mixing currencies or dates. Pick one rate and one closing date.
- Mistaking float for shares outstanding. Market cap uses total shares outstanding; float is the tradable subset.
- Trusting an undated number. If a source does not say when the figure was measured, treat it as unreliable.
- Ignoring share classes. Different classes may trade at different prices, so match each price to its own count.
Note also that a company’s percentage move and its market cap move together, since market cap is price times a share count that rarely changes in a day. That is why a price change and a market cap change match for investors, as we explain in price changes vs. market cap. For a dual-listed company, this means you can read the day’s percentage change from either listing and expect them to be close once currency moves are considered.
FAQ
What does it mean when a company is dual listed?
It means the company’s shares trade on two or more exchanges. The second listing is an additional place to trade the same ownership, not a new offering. Companies do it to reach more investors and increase liquidity.
Does a dual-listed company have two market caps?
No. It has one market cap, found by multiplying one price by the total shares outstanding for the matching class. Index and exchange methodologies, such as the one published by the Bombay Stock Exchange, treat a company listed on several exchanges as a single company when aggregating.
How do I calculate market cap from an ADR price?
Divide the ADR price by the number of ordinary shares each ADR represents, then multiply the result by total ordinary shares outstanding. Alternatively, multiply the ADR price by the number of ADSs that equal the full share count. The ratio is stated in the company’s SEC filings.
Why do two data sites show different market caps for the same dual-listed company?
Usually because of a different price date, a different currency rate, a different share count (basic vs. diluted) or a missing ADR ratio. Match the price, date and share class before you decide which figure is right.
Should I use the home-market price or the U.S. price?
Either works if you convert correctly. Many analysts use the primary home-market share and cross-check with the U.S. line, since after currency conversion the two should be close.
Sources
- Dual listing definition, Nasdaq
- Dual Listing (DL), Deutsche Börse glossary
- Understanding Dual Listing, Investopedia
- All-India market capitalization methodology, BSE
- Investor Bulletin: American Depositary Receipts, SEC
- American Depositary Receipts (ADRs), Investor.gov
- Prospectus supplement (424B5), SEC EDGAR
- Description of securities exhibit, SEC EDGAR
- ING filing exhibit, SEC EDGAR
- Asia-Pacific listings on NYSE
Recommended
For informational purposes only and is not investment advice. Do not rely on the facts, figures, ticker symbols, or other statements in this article — they may be incomplete, outdated, or incorrect, and we are not responsible for errors. See our disclaimer.