Sector Tilt Strategy: How to Overweight Sectors Without Losing Your Core
By MarketCapLens · Published · 11 min read
A sector tilt strategy keeps a diversified core portfolio and deliberately holds more of one or more sectors than the benchmark does, and less of others. You are not abandoning the index. You are leaning against it by a measured amount, because you expect a sector to do better or because you want exposure to a long-term trend. This guide explains how a tilt works, how to size one, how to monitor it, and where it goes wrong.
MarketcaplensTrack Sector Exposure With Market DataCompare sector allocations and company performance with MarketCapLens data to support your research into portfolio tilts.Explore market dataTL;DR
- A sector tilt is a deliberate overweight or underweight versus a benchmark, usually layered on a diversified core, not a replacement for it.
- Tilting differs from sector rotation (frequent moves with the business cycle) and from thematic investing (themes that cut across sectors).
- The main risk is concentration: funds with different names can overlap heavily in the same sector.
- Size the tilt in percentage points versus the benchmark, set limits in advance, and review on a schedule.
- Rebalancing a tilt in a taxable account can trigger capital gains, so count the tax cost before you trim.
Table of Contents
- What a sector tilt actually is
- Tilt, rotation and thematic investing are not the same thing
- Why investors tilt toward a sector
- How to build a sector tilt in five steps
- Examples of sector tilts in practice
- The risks a tilt adds
- Rebalancing a tilt and the tax question
- Our perspective
- Check your sector exposure with live data
- FAQ
- Sources
What a sector tilt actually is
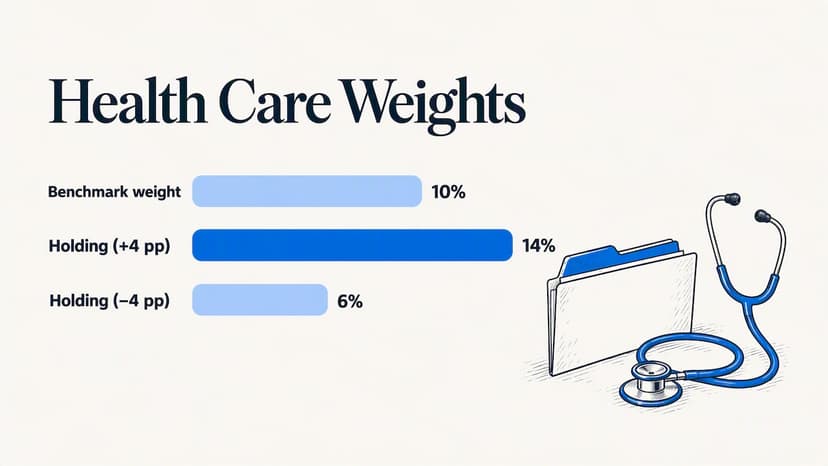
The benchmark sets the neutral position. If the S&P 500 holds a given share in Health Care, your neutral weight in that sector is the same share. A tilt is the gap between what you hold and that neutral weight. Own 14% in Health Care against a benchmark weight of 10%, and you hold a 4 percentage point overweight. Own 6% and you hold a 4 point underweight.
The idea is close to what the industry calls a tilt fund. As Investopedia describes it, a tilt fund combines a core holding that tracks a benchmark index with additional securities that may outperform, and managers may choose those securities based on sector performance and P/E ratios. You can build the same structure yourself with a broad index fund plus a few sector funds or individual stocks.
The sectors themselves come from a standard classification. The Global Industry Classification Standard, developed by MSCI and S&P Dow Jones Indices in 1999, sorts companies by primary business activity into 11 sectors: Communication Services, Consumer Discretionary, Consumer Staples, Energy, Financials, Health Care, Industrials, Information Technology, Materials, Real Estate and Utilities. If you want to see how companies line up inside each one, our sector rankings by market cap and the explainer on what a sector is are a good starting point.
Tilt, rotation and thematic investing are not the same thing
The three terms get mixed up in search results, and the differences change how you manage the position.
| Approach | What you do | Typical pace | Main judgment call |
|---|---|---|---|
| Sector tilt | Hold a standing over- or underweight versus a benchmark | Months to years, reviewed on a schedule | Which sectors, and how large a gap |
| Sector rotation | Move money between sectors as conditions change | Frequent, often monthly or by cycle stage | When the cycle turns |
| Thematic investing | Buy a trend that may span several sectors | Long-term, conviction driven | Whether the theme is real and priced fairly |
Investopedia defines sector rotation as moving money between parts of the stock market as economic conditions change, aiming for the sectors that may do better at each stage. It also notes that rotation takes more research and timing than buy-and-hold, and that misjudging the stage of the business cycle can produce losses. A tilt is the slower, calmer cousin. If you want to see a rules-based rotation, we walk through one in Hold Top 3 Sectors Monthly.
Themes are different again. DWS points out that sectors classify companies by principal business activity, while themes follow how the economy may evolve and can include companies from several sectors. An artificial intelligence theme, for example, can pull in chipmakers (Information Technology), cloud and platform companies (Communication Services or Consumer Discretionary) and power producers (Utilities). That matters for a tilt: a thematic fund can quietly push you into a sector overweight you never chose. You can browse a current example on our featured page for Magnificent 7, AI and memory stocks.
Why investors tilt toward a sector
State Street Global Advisors explains that sector strategies can adjust a portfolio around macroeconomic or thematic trends, changing fundamentals, or technical signals such as momentum. FINRA describes the underlying behavior plainly: intentional concentration, meaning a conscious decision to invest more in a sector based on performance expectations, is a primary driver of sector-based strategies.
In practice, investors tilt for four common reasons:
- A view on the economy. You expect a sector to benefit from the next phase of the cycle.
- A view on valuation or fundamentals. A sector looks cheap on earnings or is growing profits faster than the market.
- A long-term conviction. You work in, or understand, an industry and believe in its multi-year growth.
- Correcting the benchmark. A cap-weighted index can drift heavily into whatever has run up. Some investors underweight the largest sector to offset that.
The fourth reason is worth a moment. Because market-cap indexes weight companies by size, a hot sector grows its own share of the index. Checking that drift is a form of tilt too. Our guide to market concentration risk shows how to measure it with live data.
How to build a sector tilt in five steps
1. Pick the benchmark and write down its sector weights
You cannot tilt without a reference. Choose the index your core fund tracks, then record each sector’s weight. Sector weights change daily, so note the date. Our explainer on reading sector weightings covers where to find them and how to interpret them.
2. Decide the evidence behind the tilt
State Street lists four ways to build sector portfolios: top-down business-cycle analysis, thematic analysis of macroeconomic variables and trends, bottom-up company fundamentals, and technical analysis such as relative momentum. Pick one and write the reason in a sentence. If you cannot state why you hold the tilt, you will not know when to exit it.
This is also where your own rules help. Whether you lean on valuation, earnings trends or price momentum, define the signal first so that a headline does not change your mind mid-move. Our five sector performance checks, from z-scores to equal-weight comparisons, give you objective inputs.
3. Size the tilt in percentage points
Express every tilt as a gap versus the benchmark and cap it. The cap is personal, but a worked example shows the logic. This is an illustration with made-up numbers, not a recommendation:
| Sector | Benchmark weight | Your weight | Tilt |
|---|---|---|---|
| Health Care | 10% | 13% | +3 points |
| Utilities | 3% | 5% | +2 points |
| Information Technology | 30% | 25% | -5 points |
| All other sectors | 57% | 57% | 0 |
The tilts sum to zero, because the money for an overweight has to come from an underweight. Laying it out this way shows you how much “active” risk you are really taking: here, ten percentage points of the portfolio sit differently from the index. Small tilts keep the core doing most of the work.
4. Choose the vehicle and check the overlap
Sector ETFs are the usual tool. Investor.gov notes that funds make it easy to own small pieces of many investments, but narrowly focused funds such as sector funds may not provide diversification. FINRA adds that you can check fund holdings for overlap with similar funds or individual stocks.
Two cautions apply. First, labels can mislead: index providers may use different methodologies for classifying sectors, which can give differentiated exposures for funds with similar labels. Read the top holdings, not just the fund name. Second, cost: funds tracking non-traditional indexes can have higher expenses than traditional index funds, and State Street notes that commissions and ETF expenses reduce returns. If you use individual stocks, a company’s page on our site, such as Meta Platforms, shows its market cap and price so you can see how large a position it is within its sector.
For concrete fund-mix ideas, see our 3 to 5 ETF starter plans.
5. Set a review schedule and exit rules
FINRA says investors can manage concentration risk by periodically reviewing holdings and rebalancing to align with their objectives. Pick a calendar (quarterly or twice a year), plus a trigger such as a tilt drifting to more than a set number of points from your target. Then write the exit condition: the evidence you named in step 2 stops being true, or the cap is breached.
Examples of sector tilts in practice
Tilts take a few recognizable shapes. These are patterns, not predictions or past-performance claims.
- The defensive tilt. An investor worried about a slowdown overweights Consumer Staples, Health Care and Utilities and underweights Consumer Discretionary. The goal is steadier earnings, and the cost is lagging if growth sectors lead.
- The cyclical tilt. An investor expecting expansion leans toward Industrials, Financials and Materials. This ties to the business-cycle logic of rotation, but held longer.
- The conviction tilt. An investor who believes in a long-run trend, such as electrification or health innovation, holds a persistent overweight in the relevant sectors.
- The anti-concentration tilt. An investor underweights the biggest sector to offset index drift, or holds an equal-weight fund as a counterweight.
The performance record of any specific tilt depends entirely on the period you measure, so test your own idea before committing. Our guide to backtesting sector allocation with point-in-time data and real costs shows how to avoid hindsight bias, which flatters nearly every sector story told after the fact.
The risks a tilt adds
A tilt adds three kinds of risk to an index core.
Concentration. FINRA warns that concentration risk occurs when a large portion of holdings sits in a single sector, and that holding several funds does not protect you if they overlap in sector exposure. A tilt plus a thematic fund plus a growth fund can all lean on the same handful of stocks.
Timing and judgment. Every tilt is a forecast. If you are wrong about the cycle, valuation or theme, you underperform the benchmark you could have simply held. Our look at sector diversification benefits and their limits explains what you give up when you narrow your exposure.
Cost and market risk. ETF prices fluctuate, and shares may trade above or below net asset value. Expenses and trading commissions reduce returns.
None of this makes a tilt a bad idea. It means the tilt should be small enough that being wrong is survivable.
Rebalancing a tilt and the tax question
Rebalancing means adjusting holdings to realign with a target allocation. Investor.gov describes it as a tool for managing risk after one sector or asset class has grown or fallen significantly. For a tilt, that usually means trimming a sector that has run past its cap, which is the winner you would rather keep.
In a taxable brokerage account, selling a winner can create a bill. FINRA tells investors to consider the potential tax consequences, such as capital gains taxes from selling winning investments. If you are unsure how gains are taxed, a primer on the capital gains tax helps you estimate the cost before you trim. Practical ways to reduce the need to sell include directing new contributions to underweight sectors, and doing larger rebalances inside tax-advantaged accounts. For specifics on your situation, talk to a tax professional.
To learn the mechanics, read what portfolio rebalancing is, then run your numbers in our rebalancing calculator.
Our perspective
We look at sector data all day, and the pattern we see most often is not bad tilts but accidental ones. An investor holds a total market fund, a large-cap growth fund and a thematic fund, and ends up with a sector overweight larger than any deliberate tilt would be, simply because the biggest companies sit in all three.
So we suggest three habits. Measure first: know your sector weights before you decide to change them. Keep the core: State Street’s view is that tilts complement a diversified core rather than replace it, and we agree. Write the thesis down: a tilt without a stated reason and exit rule is just a hunch with a ticker.
Market-cap rankings help with all three, because they show how much of a sector rests on a few names. If the top three companies are most of a sector, an overweight in that sector is really a bet on those three.
— MarketCapLens
Check your sector exposure with live data
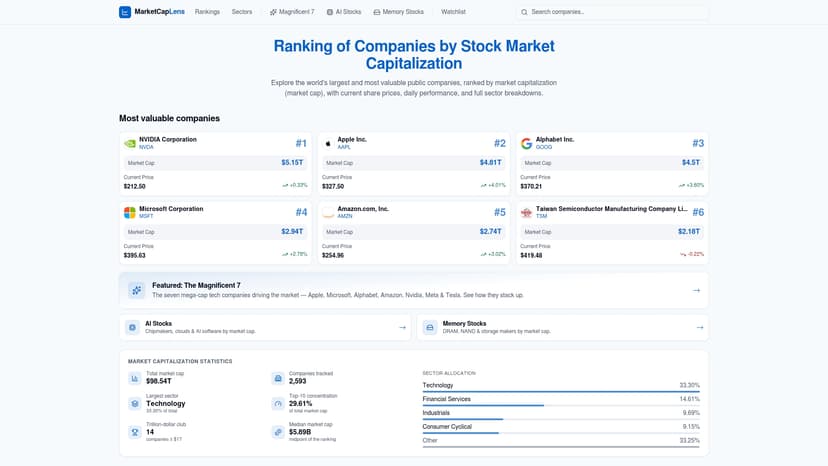
Before you add a tilt, see where you stand. MarketCapLens tracks more than 2,500 public companies, ranks them by market cap, breaks them out by sector, and refreshes the data multiple times a day. Start with the market cap rankings to see which companies dominate each sector, or use the stock calculators to size positions.
If you want a structured review, our five-step market cap concentration audit walks you through it with live figures.
FAQ
What are the 11 major sectors?
Under the Global Industry Classification Standard, they are Communication Services, Consumer Discretionary, Consumer Staples, Energy, Financials, Health Care, Industrials, Information Technology, Materials, Real Estate and Utilities. Companies are assigned by their primary business activity. Different index providers can classify some companies differently, so check the methodology of the fund you use.
Is a sector tilt the same as sector rotation?
No. A tilt is a standing overweight or underweight versus a benchmark that you review on a schedule. Rotation moves money between sectors more often as the business cycle changes, which requires more research and timing.
How big should a sector tilt be?
There is no standard answer, and it depends on your goals and risk tolerance. Many investors define the tilt in percentage points versus the benchmark and set a hard cap so that a wrong call does not dominate the portfolio. A financial professional can help you set a limit that fits your situation.
Do sector ETFs make a portfolio diversified?
Not necessarily. Investor.gov notes that narrowly focused funds, such as sector funds, may not provide diversification. Several funds can also overlap in the same sector or the same stocks, so review their holdings together.
Does a sector tilt beat the market?
Nothing guarantees it. A tilt can outperform if your view proves right and lag if it does not, and fees and taxes reduce results. Test the idea with historical data before you rely on it.
Sources
- What is a Tilt Fund? Definition, Function, and Examples (Investopedia)
- Sector Investing (State Street)
- Sector investing: a powerful portfolio tool (State Street)
- A Guide to Sector Rotation Strategies Using ETFs (Investopedia)
- Thematic Investing: Skating to the Economic Puck (DWS)
- Concentrate on Concentration Risk (FINRA)
- Asset Allocation and Diversification (Investor.gov)
- Asset Allocation and Diversification (FINRA)
- A Look at Non-Traditional Indexes and Funds That Track Them (FINRA)
- Partner Perspectives: Unlocking Potential Ahead with S&P (Vanguard)
Recommended
For informational purposes only and is not investment advice. Do not rely on the facts, figures, ticker symbols, or other statements in this article — they may be incomplete, outdated, or incorrect, and we are not responsible for errors. See our disclaimer.