VOO vs IVV: Same Index, Same 0.03% Fee, Which to Buy
By MarketCapLens · Published · 9 min read
VOO and IVV are, for nearly every investor, interchangeable. Both track the S&P 500, both carry a 0.03% total expense ratio, and over the past decade their returns differ by a fraction of a percentage point. The real differences are structural: who runs the fund, how it is built, what a share costs and when dividends are paid. Below we go through each so you can pick one and move on.
Marketcaplensmarketcaplens.comSee the Companies Behind the IndexExplore market cap rankings, sector breakdowns, and company data to understand the largest names shaping market trends.VisitTL;DR
- Both funds seek to track the S&P 500 and hold 505 stocks, so your exposure is effectively the same.
- Both list total annual operating expenses of 0.03%. The gap in 10-year returns is about 0.4 percentage points in total.
- VOO is an ETF share class of a Vanguard mutual fund. IVV is a standalone iShares ETF.
- IVV shares cost about $756 and VOO shares cost less per share than that of a typical IVV lot only if you check your broker’s quote. Fractional shares make the difference mostly irrelevant.
- If you already hold one in a taxable account, switching rarely pays. Pick the one your broker handles best and keep buying.
Table of Contents
- What VOO and IVV actually are
- VOO vs IVV side by side
- Expense ratio: a tie on paper
- Performance: close to a rounding error
- Holdings and overlap
- Structure: the one real difference
- Share price and yield
- How to choose between VOO and IVV
- Look inside the index you own
- FAQ
- Sources
What VOO and IVV actually are
VOO is the exchange-traded share class of the Vanguard 500 Index Fund. According to its SEC filing from April 2026, it seeks to track the S&P 500, a benchmark of large-capitalization U.S. stocks, by attempting to replicate the index. It trades on NYSE Arca.
IVV is the iShares Core S&P 500 ETF. Its summary prospectus states the same goal: to track the investment results of the S&P 500. It launched on May 15, 2000.
The S&P 500 is a market-cap-weighted index, which means the biggest companies carry the biggest weights. That is why both funds behave so similarly: they own the same large companies in nearly the same proportions. If you want to see how weights flow from company size, our market cap rankings show the order of the biggest names, and the Market Cap Calculator turns price times shares into a company’s size.
VOO vs IVV side by side
| Feature | VOO | IVV |
|---|---|---|
| Index | S&P 500 | S&P 500 |
| Issuer | Vanguard | iShares |
| Structure | ETF share class of a mutual fund | Standalone ETF |
| Total expense ratio | 0.03% | 0.03% |
| Holdings | 505 stocks (September 30, 2026) | 505 holdings (November 9, 2026) |
| Net assets | $1.0 trillion in the ETF class (October 31, 2026) | $875.2 billion (November 9, 2026) |
| Dividend ex-dates in 2025 | Late March, June, September, December | Mid-March, June, September, December |
Sources for the table: Vanguard fund page, Vanguard fact sheet, iShares fund page and 2025 distribution details.
Expense ratio: a tie on paper
The headline cost is identical, but the components differ. VOO’s filing shows a 0.02% management fee plus 0.01% other expenses, for 0.03% total. It also lists no transaction fees for buying, selling or reinvesting dividends through Vanguard, though other brokers set their own fees. IVV’s prospectus shows a 0.03% management fee and 0.00% other expenses, again 0.03% total.
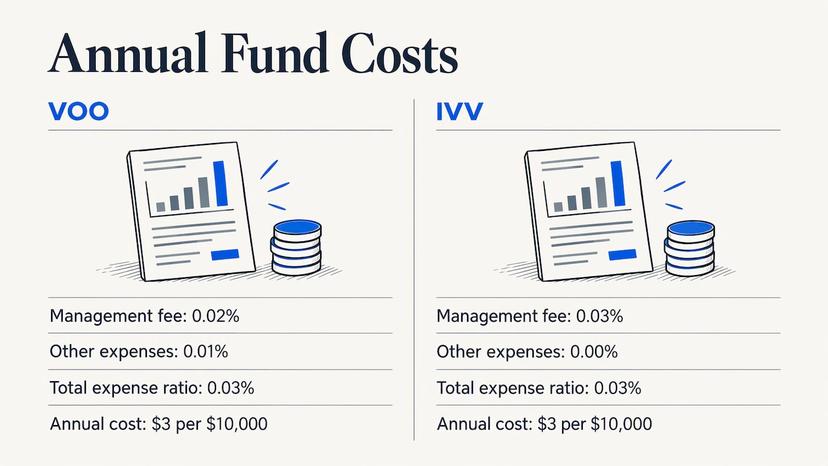
On a $10,000 holding, 0.03% is $3 a year. No investor will notice a difference between two funds with the same figure.
The subtler cost question is securities lending, where a fund lends out some of its holdings for a fee. One media analysis credits IVV’s lending program with offsetting part of its expense ratio and producing a slight edge over five years: 87.7% versus 87.62% for VOO. That is a gap of 0.08 percentage points over five years.
Performance: close to a rounding error
Because both funds follow one index, performance comparisons mostly measure tiny frictions: fees, cash drag, lending income and the timing of dividend reinvestment.
- Year to date: VOO’s return was 11.29% at market price and 11.31% at net asset value as of November 9, 2026, per Vanguard.
- Five years: IVV 87.7% against VOO 87.62%, per the analysis above.
- Ten years: VOO 318.99% against IVV 318.56%, from the same analysis.
Notice that the leader flips depending on the window. Neither fund wins consistently by a margin you could plan around. Put it in dollars: $1,000 invested ten years ago in either fund would have grown to roughly $4,190 on those figures, whichever ticker you chose. Both numbers assume dividends reinvested, as total returns do.
Past results are also no promise. As iShares notes, past performance does not guarantee future results, and shares can be worth more or less than you paid. A decade that included strong stock gains tells you little about the next one, which is why it helps to look at risk as well as return. A risk-adjusted returns worked example shows how Sharpe and Sortino ratios put two return streams on the same footing.
Holdings and overlap
Both funds hold 505 stocks: Vanguard reports 505 in VOO as of September 30, 2026, and iShares reports 505 holdings in IVV as of November 9, 2026. The S&P 500 includes more than 500 tickers because some companies have multiple share classes, so the count is not a sign of difference.
VOO’s fact sheet puts the median market cap at $462.2 billion, the price-to-earnings ratio at 24.7x and the standard deviation at 12.43%. Expect near-identical numbers for IVV because it follows the same index.
This also means that both funds share the same concentration risk. A handful of mega-cap technology and AI companies make up a large slice of the index, and owning VOO and IVV together does not diversify anything. If you want to track that weight, see our piece on S&P 500 concentration. For a look at how the index decides who is in, read our guide to S&P versus MSCI methodology.
Structure: the one real difference
VOO is a share class of the Vanguard 500 Index Fund, a mutual fund. IVV is a standalone ETF, as the same analysis notes. For most investors, that is trivia. You buy shares on an exchange in either case, and you can sell them any trading day.
It does show up in the scale of assets. As of October 31, 2026, VOO’s ETF class held $1.0 trillion, and all share classes together held $1.7 trillion, according to Vanguard. VOO crossed $1 trillion on June 2, 2026, reported as the first ETF to do so. IVV held $875.2 billion as of November 9, 2026, per iShares. Both are enormous, and both are easy to buy and sell in size.
Share price and yield
IVV closed at $756.05 on November 9, 2026, per iShares. Check your broker for VOO’s current quote, since share prices move daily. If your broker offers fractional shares, the price per share does not matter, because you can invest a set dollar amount. If it does not, a lower share price lets you invest in smaller round amounts.
Yields are close too. IVV’s 12-month trailing yield was 1.10% as of September 30, 2026. VOO’s dividend yield was 1.05% on the same date, and its 30-day SEC yield was 1.02% as of October 31, 2026, per Vanguard. Those are different measures, so do not read the 0.05-point gap as a real edge.
Payout timing differs a little. In 2025, IVV’s ex-dividend dates were March 18, June 16, September 16 and December 16, and VOO’s were March 27, June 30, September 29 and December 22, according to the analysis cited earlier. Both pay quarterly. Dates shift a little each year, so check the issuer’s page for the current calendar.
How to choose between VOO and IVV
Use these practical tests, in order:
- Where do you already hold assets? If your account is at a firm that gives commission-free trades or auto-invest on one fund, use that one. Vanguard lists no purchase, sale or reinvestment fees through its own platform, with other brokers setting their own.
- Do you already own one? Keep it. Selling in a taxable account can trigger capital gains, and the benefit of switching is close to zero.
- Do you need small, round purchases without fractional shares? The lower-priced fund is easier to size. Check both quotes first.
- Do you want a particular dividend schedule? IVV has historically gone ex-dividend a bit earlier in each quarter. That matters only if you plan around payout dates.
- Do you care about the sponsor? Some investors prefer Vanguard’s structure, others prefer iShares. Either is a legitimate preference.
If none of these applies, flip a coin. You will not regret it.
Our view on VOO vs IVV
We look at the market through market capitalization, and from that angle VOO and IVV are two doors into the same room. Both hold the same large companies, weighted by size, and both charge 0.03%.
What matters more than the ticker is what sits inside the index. The largest companies carry the most weight, so the funds move with a small group of giants. Checking that group on a regular basis, and seeing how sectors stack up, tells you more about your risk than the choice between two near-identical funds.
That is why we built MarketCapLens around rankings, sector breakdowns and daily and historical performance across more than 2,500 companies. Use the funds as the wrapper and the rankings to understand what you own.
MarketCapLens
Look inside the index you own
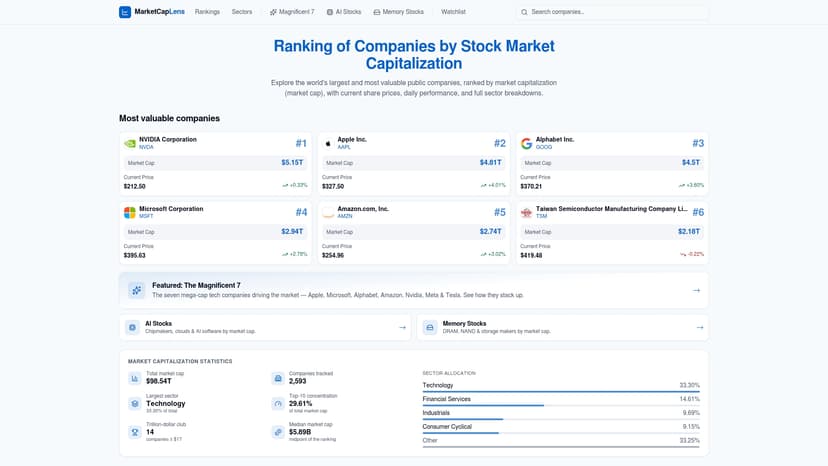
Once you have picked a fund, the useful work is understanding what it holds. MarketCapLens tracks more than 2,500 public companies, with share prices and rankings refreshed several times a day. Browse the market cap rankings to see which companies lead, or open the sector rankings to see how the index splits by industry.
If you are weighing broader funds next, our comparisons of VTI and ITOT and VT and VTI cover total market and global options. To check how each sector contributes to returns, our sector performance checks walk through five tests.
FAQ
Is VOO or IVV better?
Neither is better in any way you can count on. They track the same index at the same 0.03% total expense ratio, and the lead in returns changes with the time window. Choose by your broker, your account and your preferences.
Is VOO an ETF or an index fund?
Both. VOO is the exchange-traded share class of the Vanguard 500 Index Fund, an index mutual fund that seeks to track the S&P 500. You buy VOO shares on an exchange like any ETF.
What is IVV?
IVV is the iShares Core S&P 500 ETF, a standalone ETF that seeks to track the S&P 500. It began trading on May 15, 2000, and held $875.2 billion in net assets as of November 9, 2026.
What if I invested $1,000 in VOO ten years ago?
Using the 10-year return of 318.99% cited above, $1,000 would have grown to about $4,190. IVV’s 318.56% gives almost the same result. Past performance does not guarantee future results.
Sources
- Vanguard 500 Index Fund filing, SEC, April 2026
- iShares Core S&P 500 ETF summary prospectus
- iShares Core S&P 500 ETF (IVV) fund page
- Vanguard S&P 500 ETF (VOO) fund page
- Vanguard S&P 500 ETF fact sheet
- IVV beat VOO by 10 basis points, 24/7 Wall St.
- VOO becomes first ETF to cross $1 trillion
- Risk-adjusted returns worked example
Recommended
For informational purposes only and is not investment advice. Do not rely on the facts, figures, ticker symbols, or other statements in this article — they may be incomplete, outdated, or incorrect, and we are not responsible for errors. See our disclaimer.